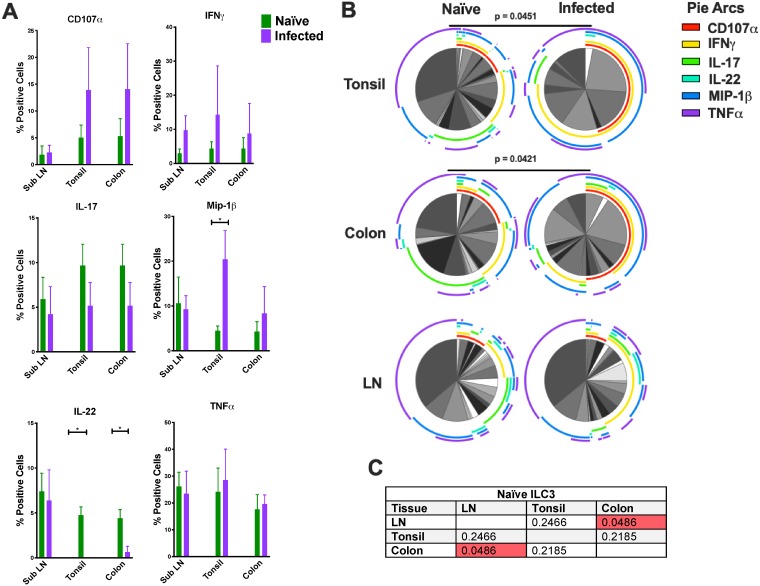
FIG 7.
(A) Bar graphs depicting CD107a and intracellular cytokine responses in ILC3 following mitogen stimulation. (B) Multiparametric analyses of the data shown in panel A were performed using SPICE 6.0 software. Pies indicate means of results from 3 to 8 animals per group for each multifunction, and arcs show an overlap of individual functions (Naïve, SubLN n = 6, tonsil n = 8, and colon n = 6; Infected [SHIV+], SubLN n = 6, tonsil n = 3, and colon n = 4). (C) P values for results of comparisons of naive ILC3 data performed using multiparametric SPICE analysis. The Mann Whitney U test was used to compare different quadrant populations. *, P < 0.05; **, P < 0.01; ***, P < 0.005.

