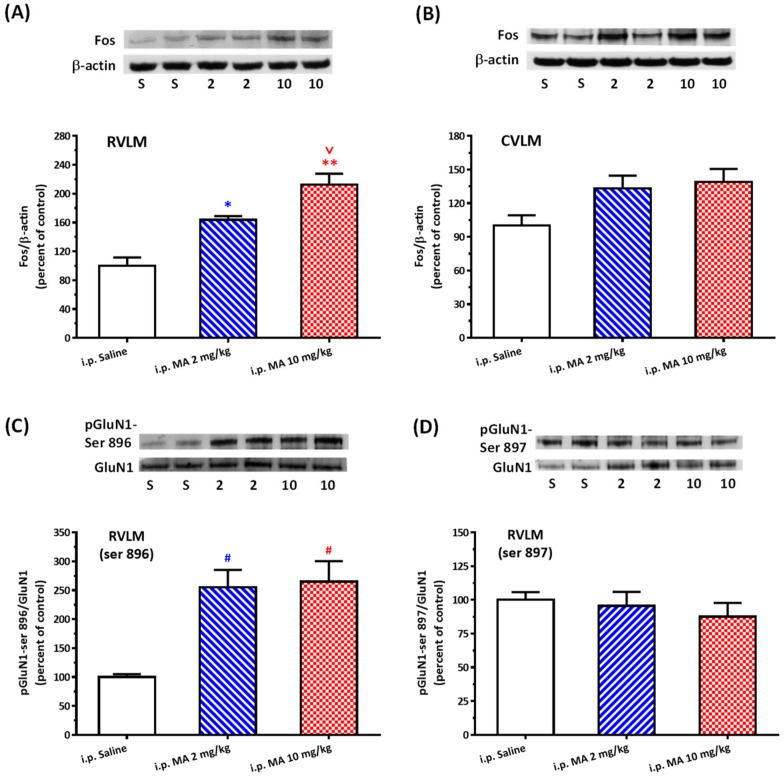
Figure 2.
Effects of intraperitoneal (i.p.) injection of methamphetamine (MA) on Fos expression and phosphorylation of GluN1 serine residue in conscious Sprague Dawley rats. (A) Top panel shows representative Western blot analysis of the levels of Fos and β-actin in the rostral ventrolateral medulla (RVLM) 2 h after i.p. injection of saline (S), MA 2 mg/kg (2), and MA 10 mg/kg (10). The percentage changes in the ratio of FOS to β-actin are shown in the bottom graph. The ratio treatment with saline is taken as a control of 100%. Values represent the mean +SEM, n = 4 animals in each group. * p < 0.05, ** p < 0.001 versus saline, and v p < 0.05 versus MA 2 mg/kg analyzed by one-way ANOVA followed by Bonferroni’s multiple comparison post-test. (B) Similar to the legend of (A) except that the tissue was taken from the caudal ventrolateral medulla (CVLM), n = 6 animals in each group. (C) Top panel shows representative Western blot analysis of the levels of phosphoserine 896 on the GluN1 subunit (pGluN1-Ser 896) and GluN1subunit (GluN1) in the RVLM 30 min after i.p. injection of saline (S), MA 2 mg/kg (2), and MA 10 mg/kg (10). The percentage changes in the ratio of pGluN1-Ser 896 to GluN1 are shown in the bottom graph. The ratio treatment with saline is taken as a control of 100%. Values represent the mean + SEM, n = 6 animals in each group. # p < 0.01 versus saline analyzed by one-way ANOVA followed by Bonferroni’s multiple comparison post-test. (D) Similar to the legend of (C) except that the phosphorylated site is the GluN1 serine 897 residue (pGluN1-Ser 897), n = 6 animals in each group.

