Figure 8.
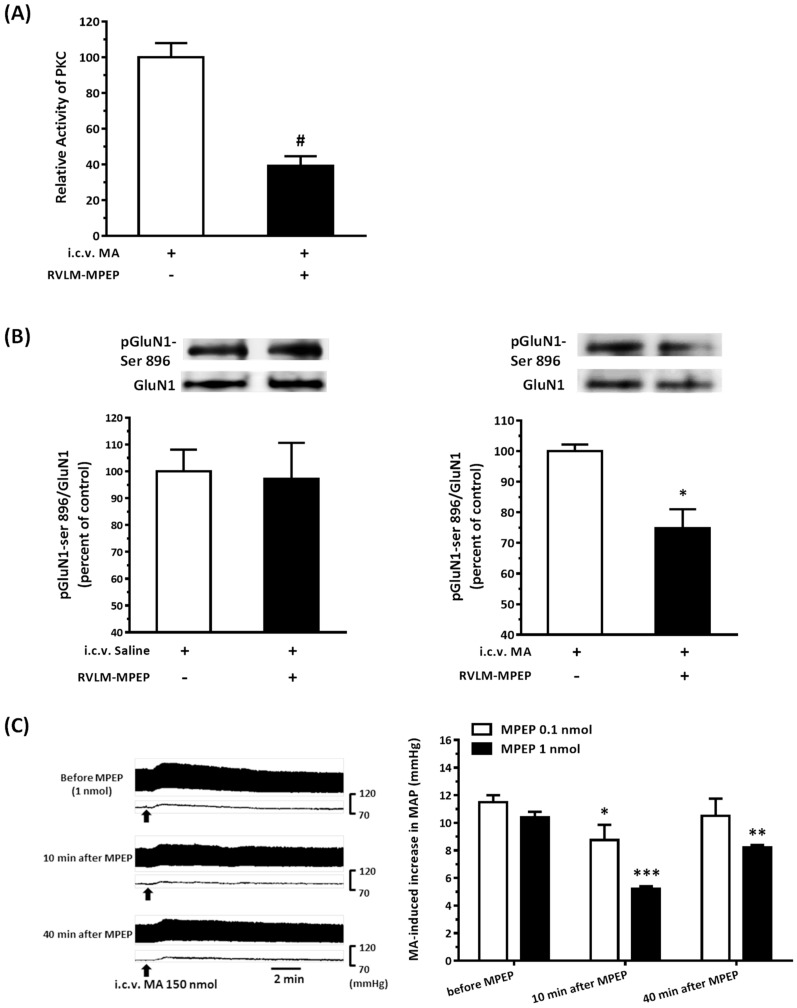
Effects of a selective metabotropic glutamate receptor (mGluR5) antagonist 2-methyl-6-phenylethyl-pyrididine (MPEP) on the intracerebroventricular (i.c.v.) injection of methamphetamine (MA) induced an increase in the PKC activity, phosphorylation of GluN1 serine 896 residue, and pressor effects in urethane-anesthetized Sprague Dawley (SD) rats. (A) Bar graph shows the relative activity of PKC in the rostral ventrolateral medulla (RVLM) 5 min after i.c.v. injection of MA 150 nmol. MPEP (1 nmol) was microinjected into the RVLM unilaterally 10 min before i.c.v. administration of MA. The RVLM tissue with the MPEP injection side shows RVLM-MPEP+, and without the MPEP injection side shows RVLM-MPEP−. The relative PKC activity with MA and without MPEP (RVLM-MPEP−) are taken as a control of 100%. Values represent the mean + SEM, n = 3 animals in the set of tests. # p = 0.0048 versus control analyzed by unpaired t-test. (B) The top panels show representative Western blot analysis of the levels of phosphoserine 896 on the GluN1 subunit (pGluN1-Ser 896) and the GluN1subunit (GluN1) in the RVLM 5 min after i.c.v. injection of saline (left) or MA (150 nmol) (right) with or without microinjection of MPEP (1 nmol) into the RVLM. The percentage changes in the ratio of pGluN1-Ser 896 to GluN1 are shown in the bottom graphs. The ratio treatment with saline (left) or MA (right) and without MPEP (RVLM-MPEP−) are taken as a control of 100%. Values represent the mean + SEM, n = 3 animals in each set of tests. * p = 0.0183 versus corresponding control analyzed by unpaired t-test. (C) Left: Representative recordings show an increase in pulsatile arterial pressure and mean arterial pressure (MAP) following i.c.v. administration of MA (150 nmol) 20 min before and 10 and 40 min after unilateral microinjection of MPEP (1 nmol) into the RVLM in a SD rat. Right: Bar graph shows an MA-induced increase in MAP before and 10 and 40 min after unilateral microinjection of MPEP (0.1 nmol, 1 nmol) into the RVLM. Values represent the mean + SEM, n = 4 animals in the MPEP 0.1 nmol group and n = 5 animals in the MPEP 1 nmol group. * p < 0.01, ** p < 0.001, and *** p < 0.0001 versus corresponding before MPEP in one way ANOVA repeated measures followed by Bonferroni’s multiple comparison post-test.

