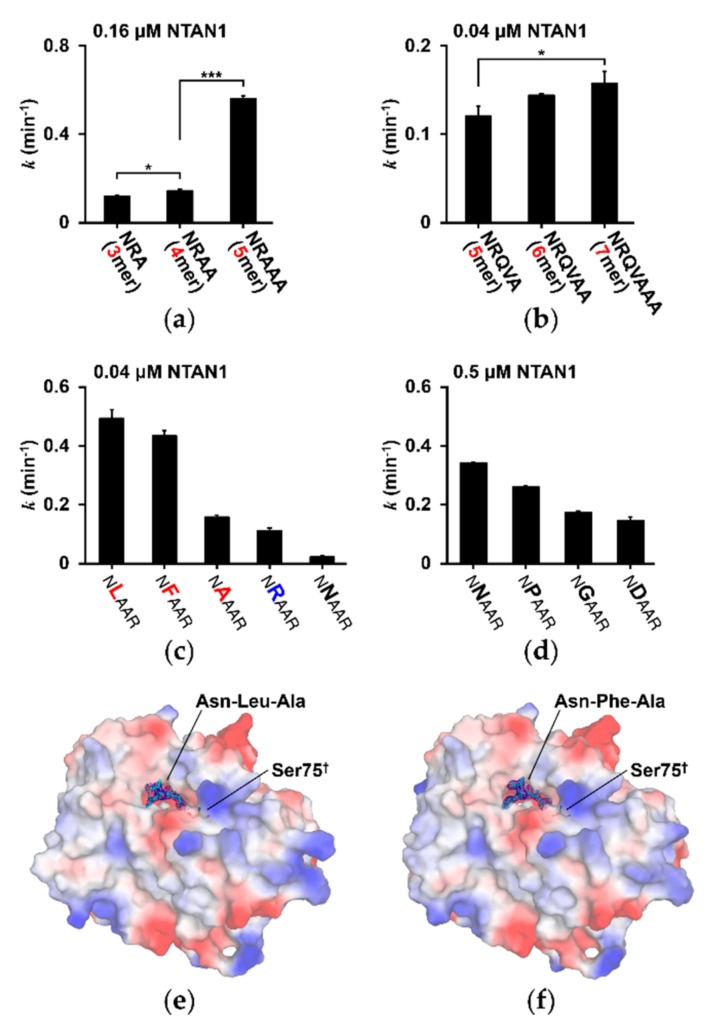
Figure 2.
NTAN1 shows different deamidation rates on various Nt-Asn peptides. (a) Deamidation rates of NRA, NRAA, and NRAAA peptides for 0.16 μM NTAN1. Deamidation coefficient was obtained from the slope when the logarithmic concentrations of the substrates were plotted against incubation times. p values were determined using Bonferroni’s multiple comparison test; *** p < 0.005, * p < 0.05). Error bars indicate standard-deviation values of three independent experiments. (b) Deamidation rate of NRQVA, NRQVAA, and NRQVAAA peptides for 0.04 μM NTAN1. (c) Deamidation rates of NXAAR peptides measured with 0.04 μM NTAN1, where the second-position X represents Leu (L), Phe (F), Ala (A), Arg (R), and Asn (N). The hydrophobic and basic residues in second-position are labeled in red and blue, respectively. (d) Deamidation rates of NXAAR peptides measured with 0.5 μM NTAN1, where the second-position X represents Asn (N), Pro (P), Gly (G), and Asp (D). (e,f) Electrostatic surface of NTAN1 C75S mutant structures in complex with NLAAR (e) and NFAAR (f) pentapeptides. Catalytic Cys75 residues mutated to Ser75 are labeled with daggers. The positively, negatively, and neutrally charged surfaces are colored in blue, red, and white, respectively. Three amino acid residues with definitive electron density from the N-terminus of the pentapeptides are shown as stick models and colored in cyan and the electron densities of mFo-DFc omit maps are represented by blue meshes at a 3.0σ contour level.

