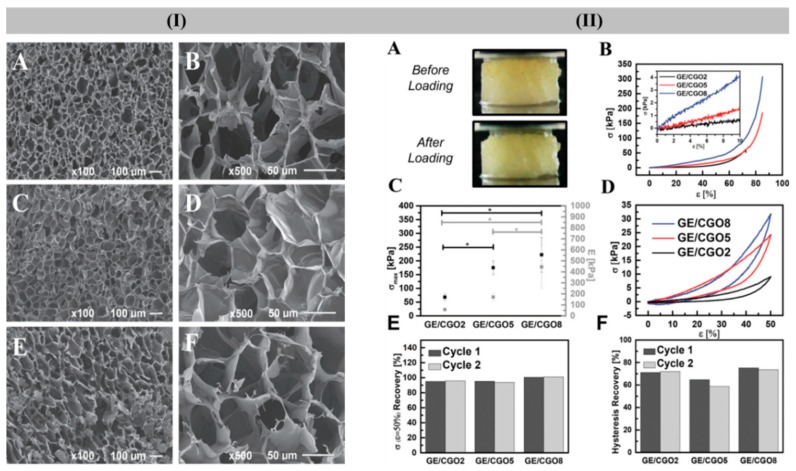
Figure 7.
(I) SEM images of freeze-dried GE/CGO2 (A,B); GE/CGO5 (C,D); and GE/CGO8 (E,F) sponges at scale bar of 100 μm and 50 μm, respectively. (II) Mechanical analysis: (A) digital images of GE/CGO8 hydrogels before and after compression (until 90% strain); (B) stress–strain curves of GE/CGO hydrated hydrogels (inset: magnified region (0–10% of strain) for measuring compressive modulus (E); (C) maximum compressive stress (σmax) and modulus (E) of GE/CGO sponges; (D) loading–unloading cycles of GE/CGO sponges until 50% of strain, and (E,F) recovery of the compressive stress at 50% of strain and hysteresis upon three successive loading–unloading cycles, respectively. Reproduced with the permission from [7]. Copyright 2019, John Wiley and Sons.

