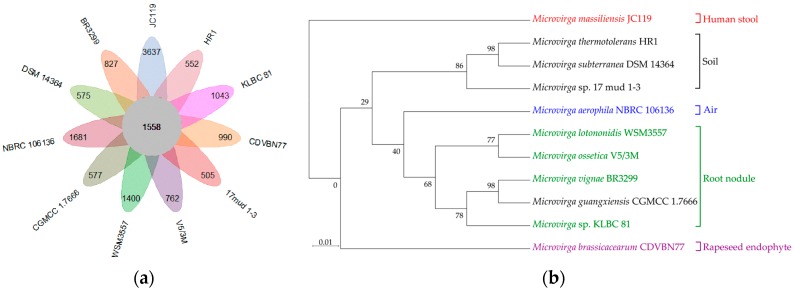
Figure 4.
The Pangenome analysis and the genome phylogenetic tree of strains belonging to the Microvirga genus. (a) Petal diagram of the pangenome. Each strain is represented by a colored oval. The center is the number of orthologous coding sequences shared by all strains (i.e., the core genome). Numbers in nonoverlapping portions of each oval show the numbers of CDSs unique to each strain. The total numbers of protein-coding genes within each genome are listed in Table 3. (b) Groups divided into five groups based on the phylogenetic tree, which is based on 1558 core orthologous proteins of the Microvirga genus. Bootstrap values are expressed as percentages of 1000 replications. Bar: 0.01 substitutions per amino acid.

