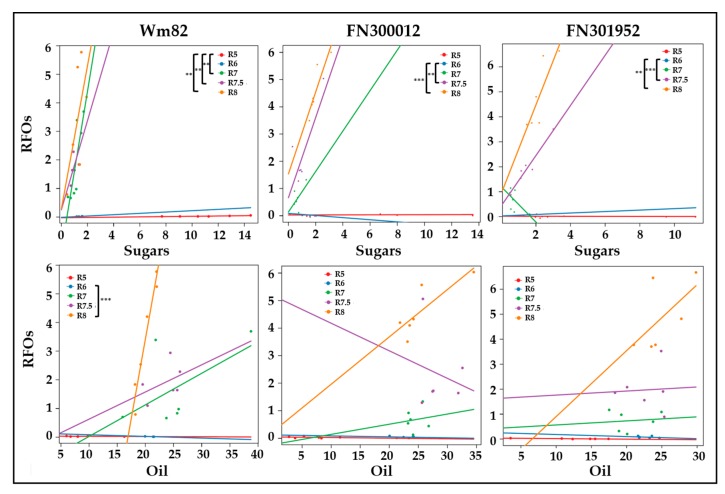
Figure 5.
Linear models between sugars and RFOs (top panel) or oil content and RFOs (bottom panel) represented by regression lines, color coded for developmental time points (R5–R8). Statistically significant differences in slopes between time points that represent a change in the direction of carbon flow are marked for each of the three lines, namely Williams 82, FN300012, and FN301952. ** p < 0.01 and *** p < 0.001. Units for both axes represent % biomass. Sugars represent the sum of glucose, fructose, and sucrose. RFOs represent raffinose and stachyose together.

