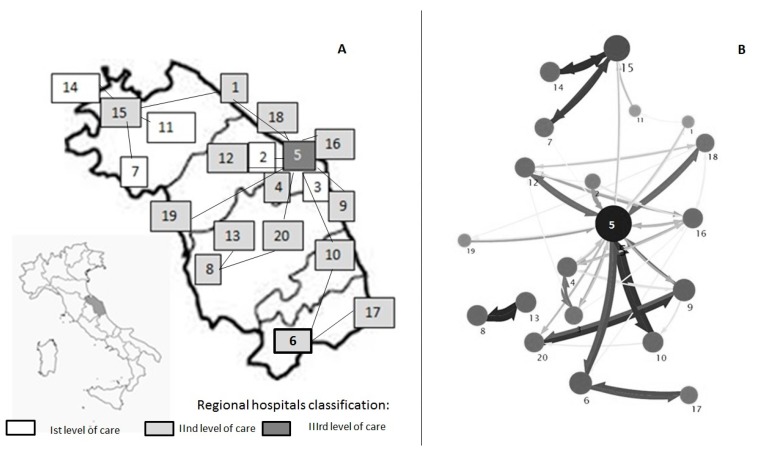
Figure 1.
Distribution of hospitals according to level of care, and reciprocal hub-and-spoke connections (A), and mapping of inter-facility transfer of CRKP isolates within the Marches hospital network (B). (Marches region, Italy, 2014). Each hospital structure is represented by a grey circle. The diameter of the circle is proportional to the amount of MDROs exchanged. The color intensity and the size of the arrows represents the number of CRKP exchanged between hospitals. The direction of the arrows represents the direction of the exchanges. The map has been realized using the Mapequation software (http://www.mapequation.org/)

