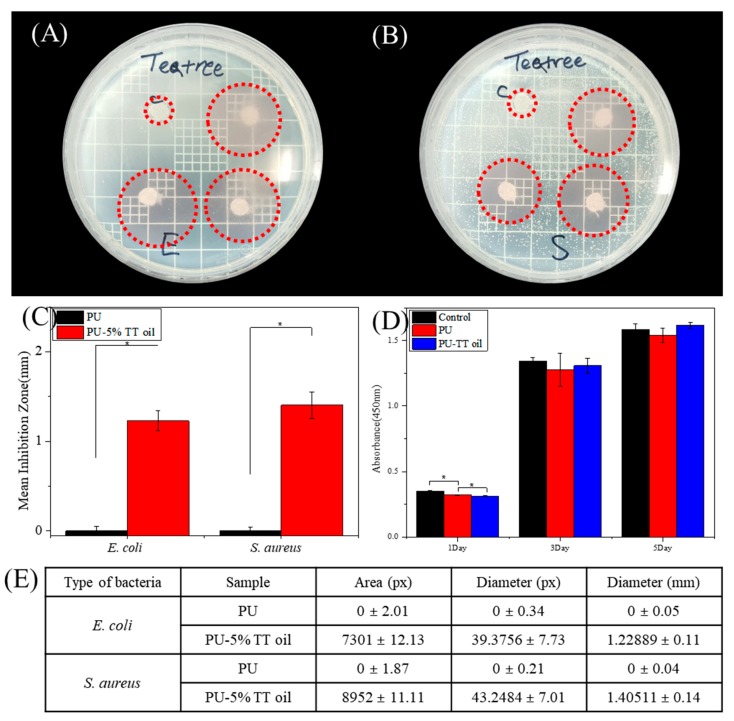
Figure 3.
Representative images of the zone of inhibition using (A) Escherichia coli and (B) Staphylococcus aureus after 24 h after adhered samples. (C) The graph of inhibition zone diameter by Image J software. The data represent the mean three standard deviations with statistical significance. (D) Cytotoxicity test by CCK-8 assay on NIH-3T3 cell culture onto each sample at day 1, 3 and 5. (E) Comparison of antibacterial effect of PU and PU-5% TT oil using different type of bacteria (* indicates statistical significance (p < 0.05) measured by a one way ANOVA Tukey test).

