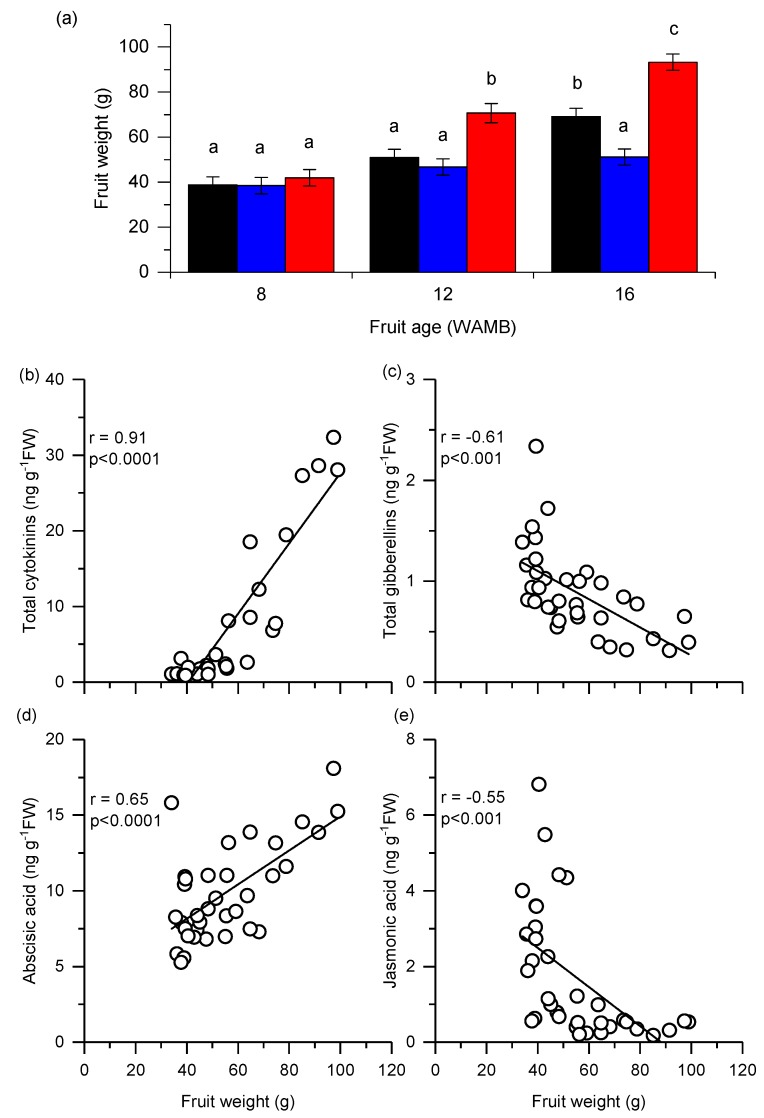
Figure 1.
Fruit weight of kiwifruit (a) at three key stages of development: 8, 12, and 16 weeks after mid bloom (WAMB). Untreated control (black bar; vine standard), low carbohydrate supply (blue bar), and high carbohydrate supply (red bar). Values are averages ± SEM (n = 3 or 4). Statistical analysis by linear mixed effects model with type 3 sums of squares Kenward–Roger’s method; different letters mean a statistical difference, adjusted for multiple comparison by Tukey’s correction (p < 0.05). Pearson correlation analysis of between fruit weight and (b) total cytokinins, (c) total gibberellins, (d) abscisic acid, and (e) jasmonic acid concentration in fruit outer pericarp. n = 33 for cytokinins and n = 35 for the other phytohormones. FW, fresh weight.

