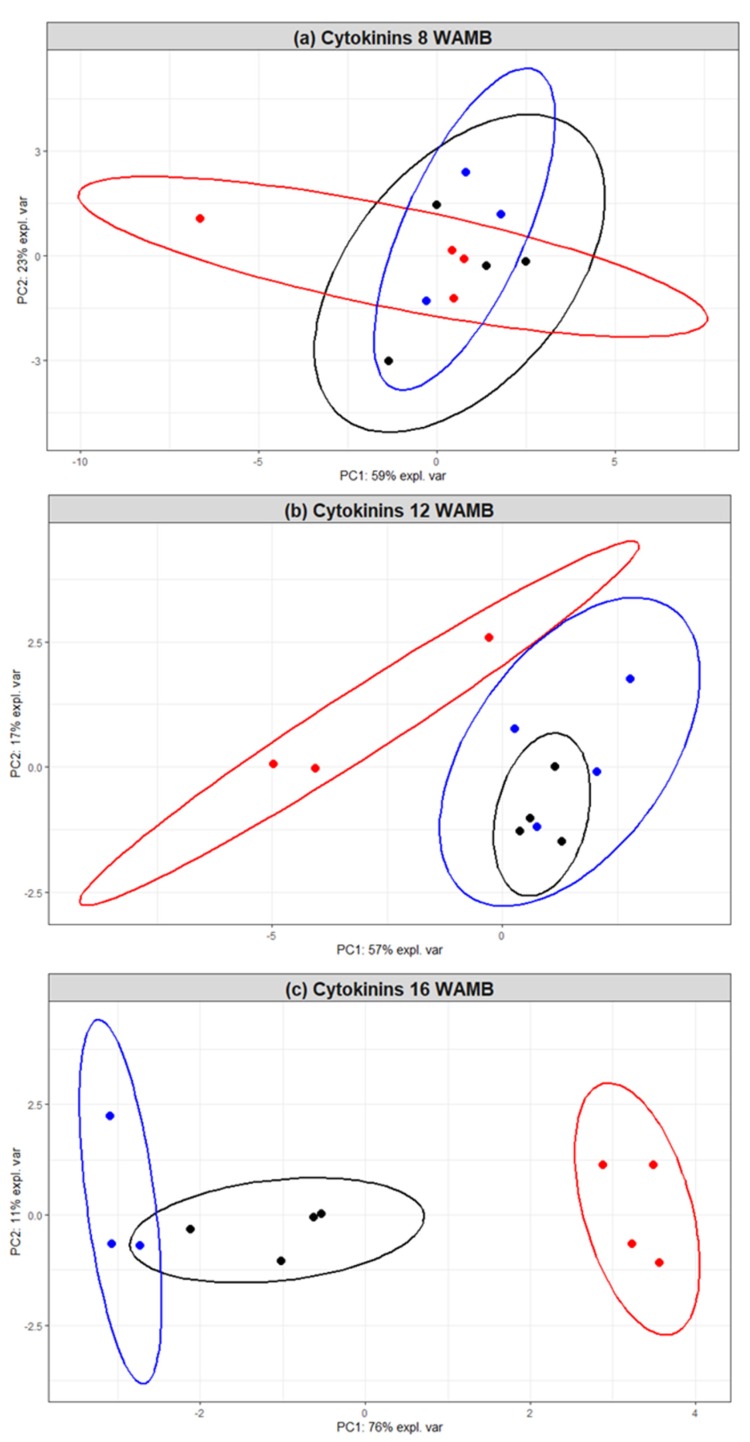
Figure 3.
Principal component analysis (PCA) based on cytokinin concentrations in the outer pericarp of developing kiwifruit: (a) 8 weeks after mid bloom (WAMB); (b) 12 WAMB; (c) 16 WAMB. Black, untreated control (vine standard); blue, low carbohydrate supply (carbon starvation); red, high carbohydrate supply. PC, principal component. Confidence ellipses: p < 0.05.

