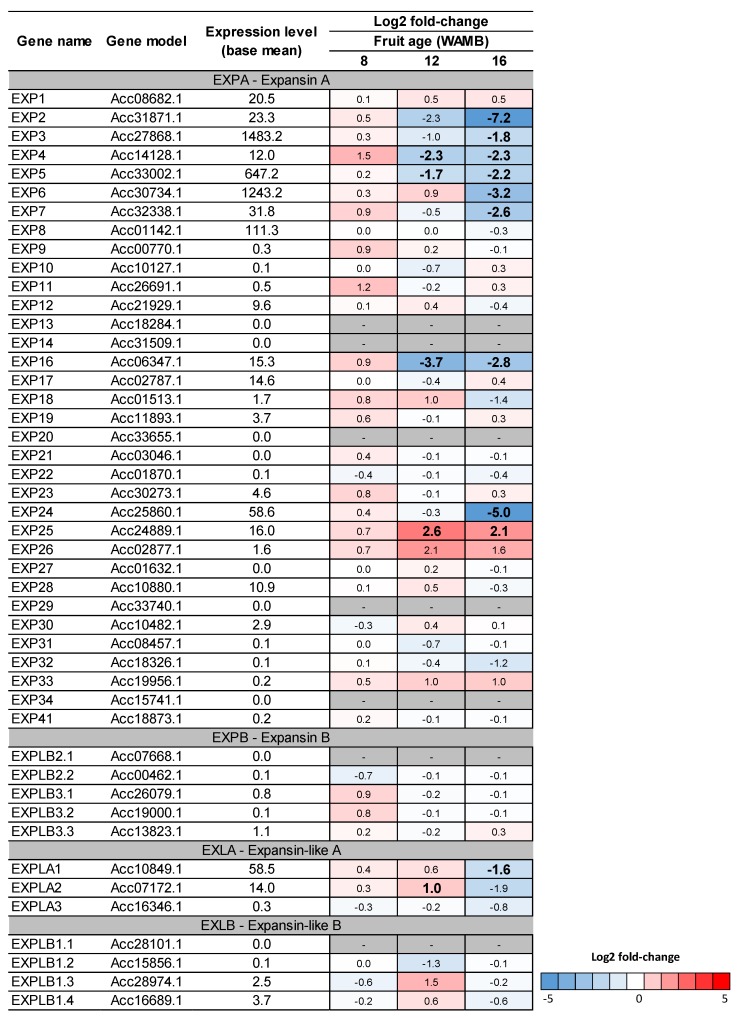
Figure 8.
Heat-map of kiwifruit expansin genes. DESeq comparison of low carbohydrate supply (carbon starvation) versus high carbohydrate supply treatments. Differentially expressed genes were identified based on the DESeq analysis from Nardozza et al. [6]. For each gene, the expression level (base mean) and the log2 fold-change are presented. Fruit age is in weeks after mid bloom (WAMB). Bold figures mean differences are significant for adjusted p < 0.05 (DESeq analysis).

