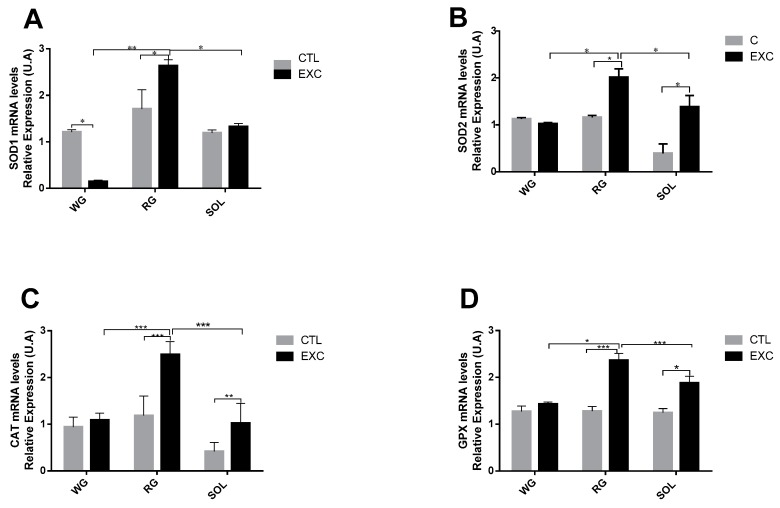
Figure 7.
Quantification of mRNA expression of NADPH oxidase (NOX)-regulated antioxidant genes including superoxide dismutase-1 (SOD1) (A), superoxide dismutase 1 SOD2 (B), catalase (C) and glutathione peroxidase (GPX) (D) from the Control (CTL) and exercise (EXC) groups. Data are shown as mean ± S.E.M. (n = 8/group). * p < 0.05; ** p < 0.01; *** p < 0.001.

