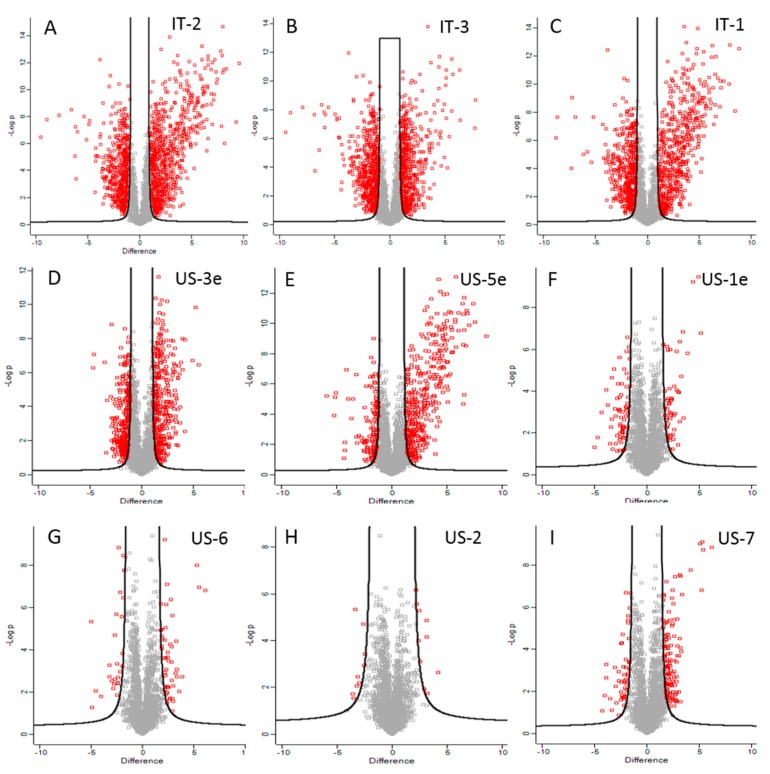
Figure 1.
Perseus volcano plots representing proteins with differential abundance (red squares) between the tested VSL#3 samples and US-4. For each protein, significance expressed as p-value was graphed in function of difference between samples (log2 fold change). Red squares in the right area of each volcano plot represented proteins significantly more abundant in IT- and US-products while red squares in the left side of plots corresponded to proteins more abundant in the US-4 product.

