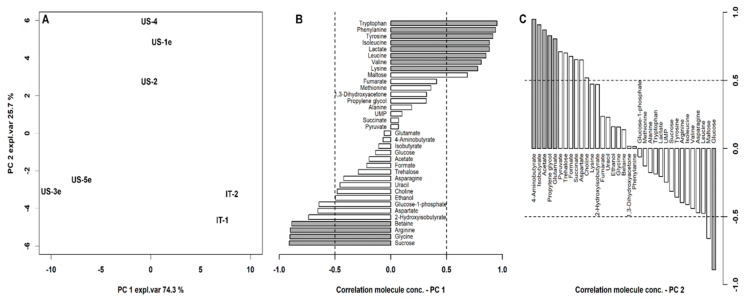
Figure 5.
(A) Score plot of an rPCA model on the molecules quantified by proton nuclear magnetic spectroscopy (1H-NMR) on VSL#3 products. (B,C) Correlation between molecules concentration and their importance over PC1 and 2, respectively. Gray bars highlight statistically significant correlations (p < 0.05).

