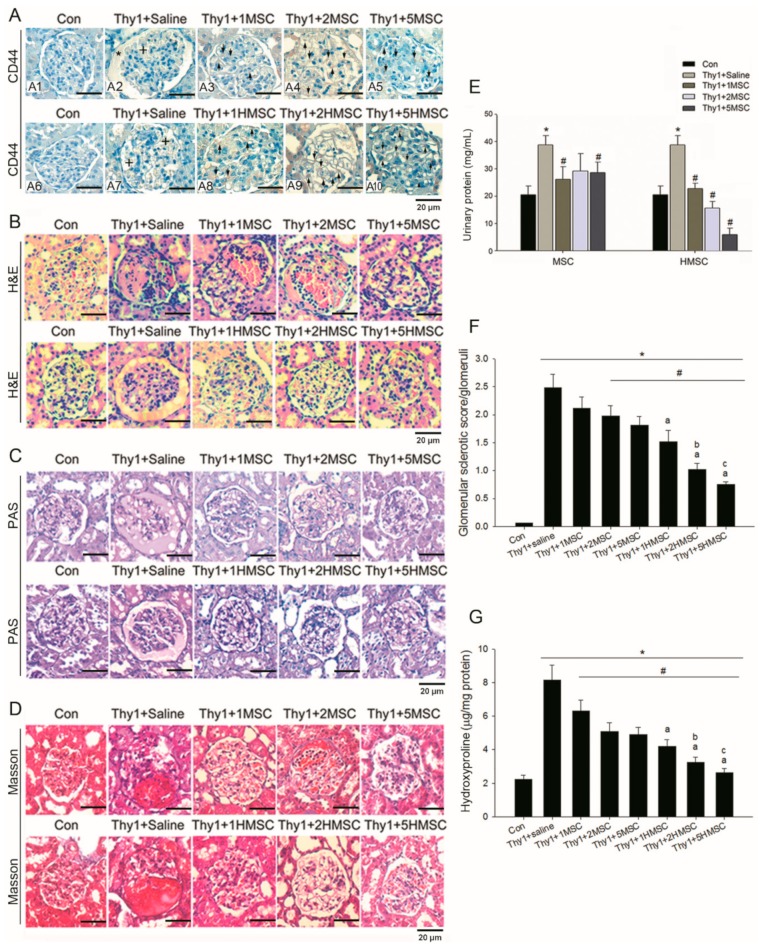
Figure 2.
Representative pictures of immunohistochemical stained sections for CD44, a marker for MSC, in ten groups of rats show CD44 positive stains in the glomeruli indicated by arrows in MSCs or HMSCs treated kidneys compared to control kidney (A1–10). Anti-Thy1.1 evoked mesangial lysis (indicated by +) and the mesangial matrix accumulation (indicated with *) in the nephritic rats. Intrarenal MSCs transplantation ameliorated anti-Thy1.1-induced nephritis in the rat model. Normoxic (MSC) and hypoxic MSCs (HMSC) markedly reduced the inflammatory cell infiltration in the glomeruli in H&E stains (B). The severity of glomerulosclerosis was explored in both normoxic MSC and HMSC treated rats in PAS stains (C) and in Masson stains (D). Thy1-induced nephritis significantly elevated urinary protein level and the elevated urinary protein level was significantly reduced by intrarenal MSC or HMSC treatment (E). Glomerular sclerotic index calculated by the PAS sections among the experimental groups are presented in (F). Thy1-induced nephritis significantly increased glomerular sclerosis in all nephritis treated groups as compared to Con group. MSC at cell number (2–5) × 105 level and HMSC at cell number (1–5) × 105 level significantly reduced sclerosis degree. Glomerular fibrosis determined by the hydroxyproline contents among all groups of animals are presented in (G). Thy1-induced nephritis significantly increased renal hydroxyproline content in all nephritis treated groups as compared to Con group. MSC and HMSC significantly reduced renal fibrotic degree. Each graph is amplified at 400×. The scale bar (20 μm) is indicated in each graph. * p < 0.05 vs. Con group. # p < 0.05 vs. Thy1 group. a p < 0.05 vs. Thy1 + 1MSC group. b p < 0.05 vs. Thy1 + 2MSC group. c p < 0.05 vs. Thy1 + 5MSC group.

