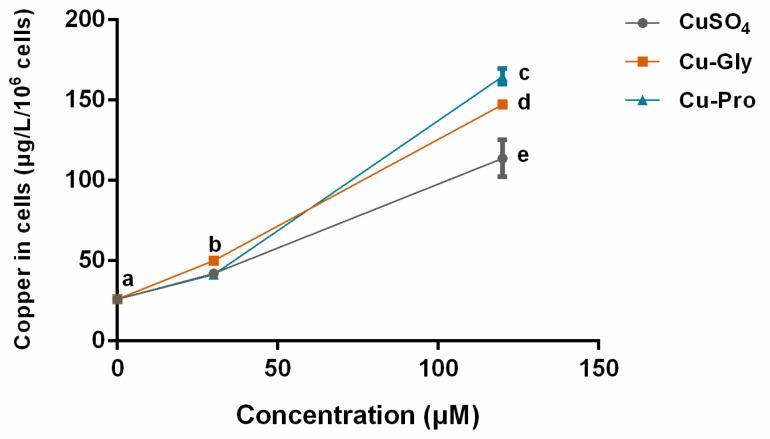
Figure 2.
Intracellular copper concentration per 106 cells. Cells were treated with CuSO4, Cu Glycine (Cu-Gly), and Cu proteinate (Cu-Pro) at the concentrations of 30 and 120 μM for 10 h. The result was measured by ICP-MS. Data represent mean values ± standard deviation (n = 3). Significant differences between processing groups are represented by different lowercase letters (p < 0.05).

