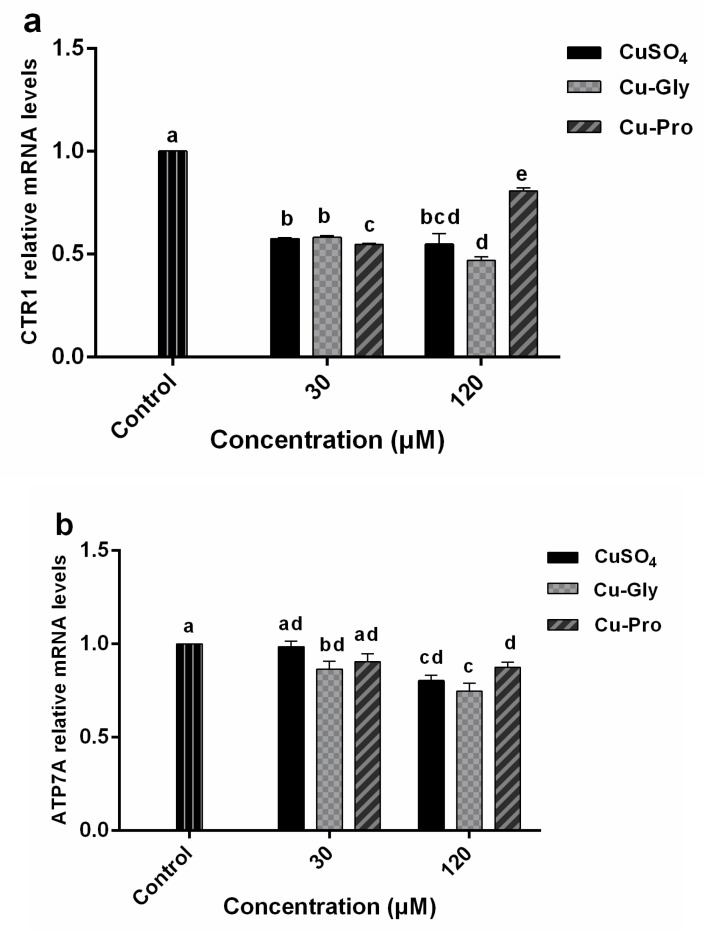
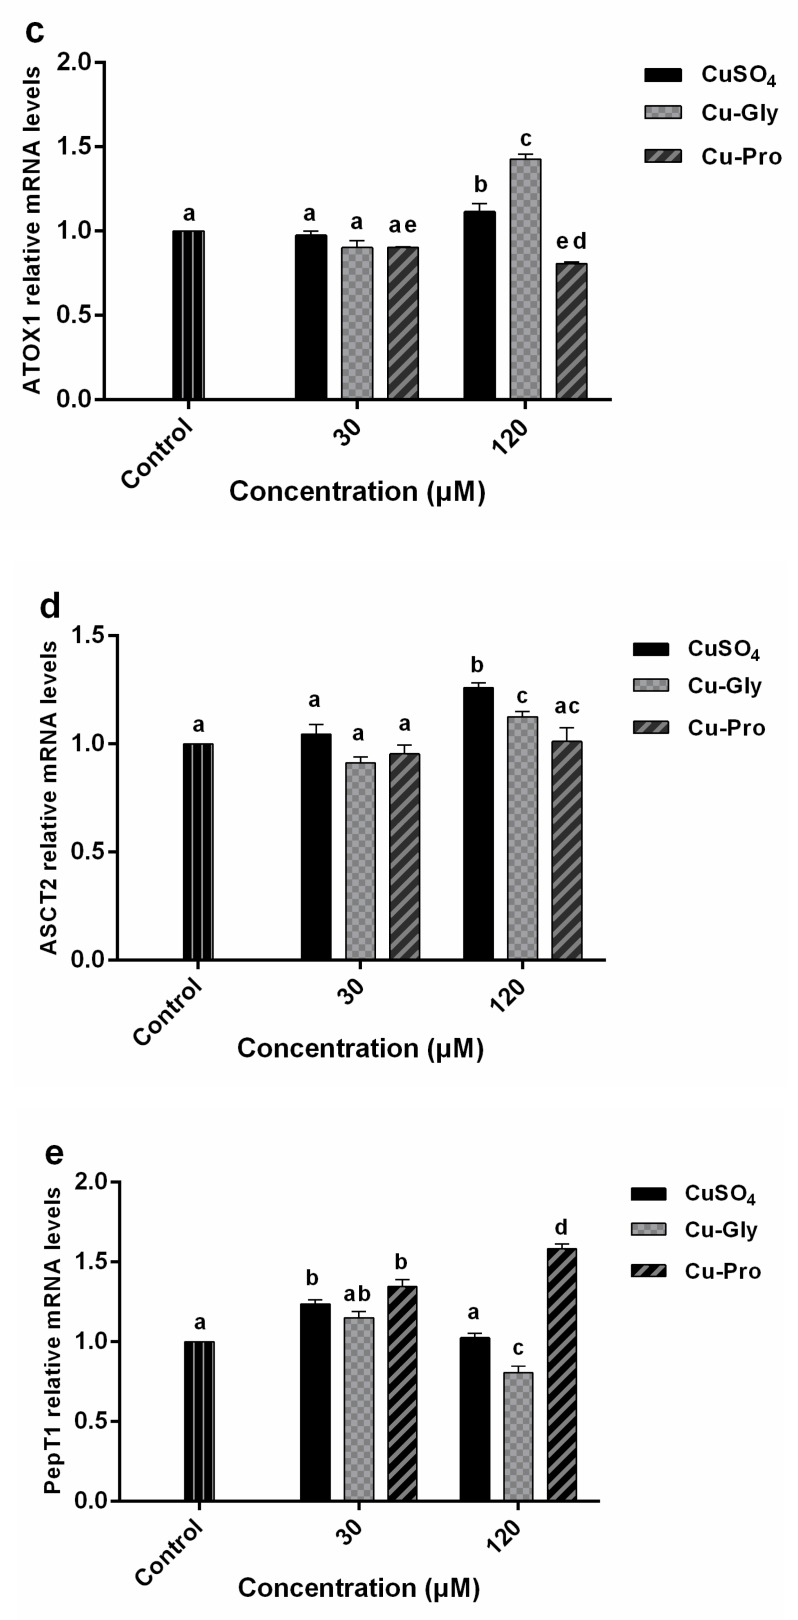
Figure 4.
The relative mRNA expression levels of CTR1 (a), ATOX1 (b), ATP7A (c), ASCT2 (d), and PepT1 (e) in IPEC-J2 cells. Cells were treated with CuSO4, Cu-Gly, and Cu-Pro at the concentrations of 30 and 120 μM for 10 h. β-actin was used as the reference gene. The results were normalized to the gene expression in control conditions. Data represent mean values ± standard deviation (n = 3). Significant differences between processing groups are represented by different lowercase letters (p < 0.05).


