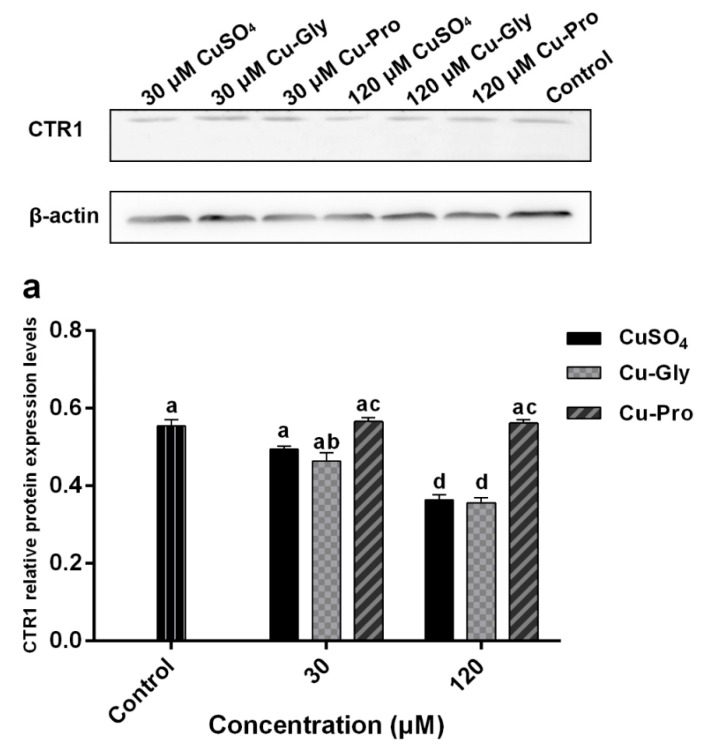
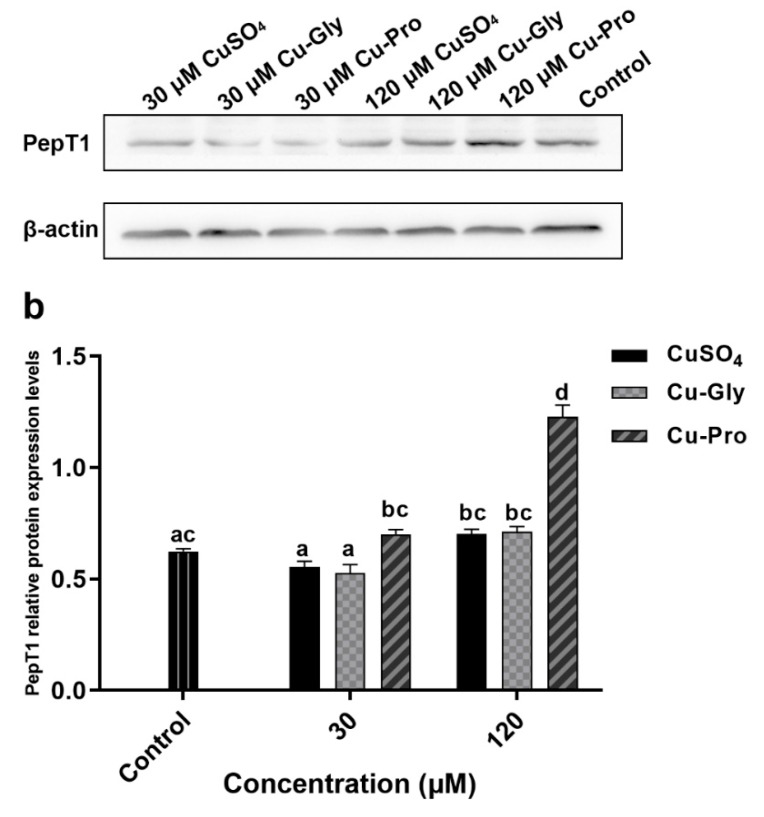
Figure 5.
The protein expression of (a) CTR1 and (b) PepT1 measured by Western blotting. Cells were treated with CuSO4, Cu-Gly, and Cu-Pro at the concentrations of 30 and 120 μM for 10 h. The densitometry of blot images normalized to β-actin levels for each lane. Significant differences between processing groups are represented by different lowercase letters (p < 0.05).


