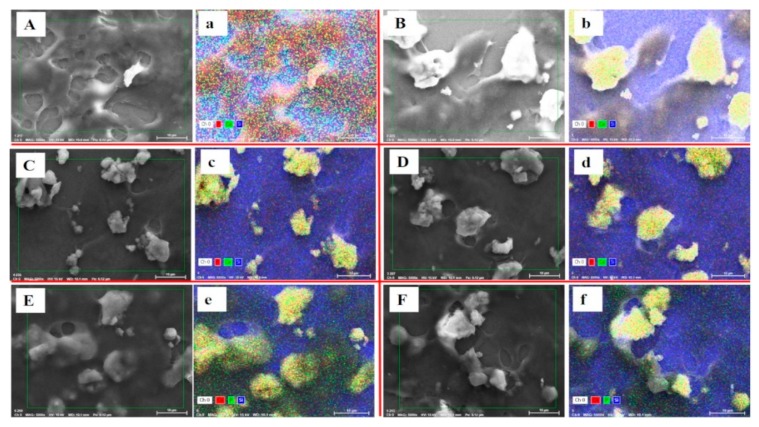
Figure 13.
Cellular uptake observation by SEM and SEM-EDS elemental analysis mapping in monolayer HCT116 colon cancer cell treated at 100 µL and incubated for 48 h with HAPs (A,a), HAP-Ps (B,b), HAP-Pip9.3-GA (C,c), HAP-P-Pip9.3-GA (D,d), HAP-Pip9.3-GA-FA (E,e), and HAP-P-Pip9.3-GA-FA (F,f). Yellow color in elemental mapping images show the presence of both calcium and phosphorus (main components of HAP nanoparticles). Red dots correspond to calcium, and green dots to phosphor. Blue color is due to silicon present in the cover glass used for culture cells. Scale bar = 10 µm.

