Figure 2.
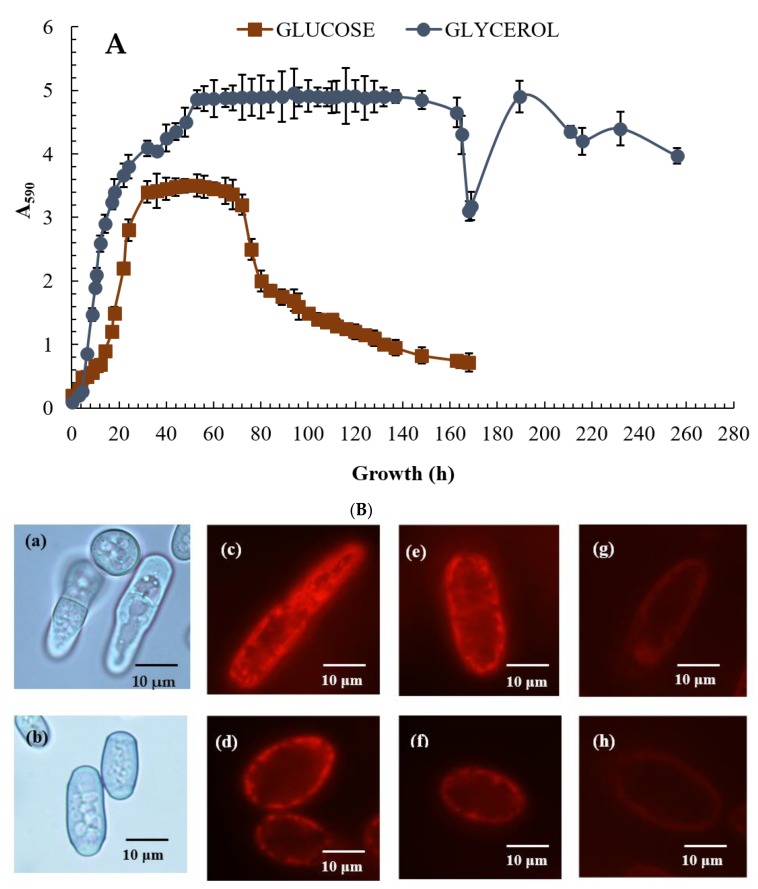
Growth curves of the E. magnusii yeast (A) and cell energy status (B) on glycerol- and glucose-containing media. (A)—absorbance was assessed every two hours in cell suspension at the wavelength of 590 nm (A590) using the spectrophotometer. The presented data are the mean of three independent cultivations (with comparable results) each in triplicate with the standard deviation. (B)—micro-images of the E. magnusii yeast in the logarithmic growth phase in glycerol–(a) and glucose–(b)-containing media. (B), (c–h)—potential-dependent staining of the E. magnusii cells raised in the different growth phases with Rh123. The cells were incubated with 0.5 µM Rh123 and examined after 0, 15, 20, and 30 min. Incubation medium contained 0.01 M phosphate-buffered saline (PBS), 1% glycerol or 1% glucose, pH 7.4. The regions of high mitochondrial polarization are bright-red due to concentrated dye. (Ba,c,e,g)—glycerol-containing media; (Bb,d,f,h)—glucose-containing media. (c,d)—logarithmic phase; (e,f)—96 h of growth; (g,h)—168 h of growth. To examine the Rh123-stained preparations, filters of 02, 15 (Zeiss) were used (magnification × 100). Photos were taken using an AxioCam MRc camera.

