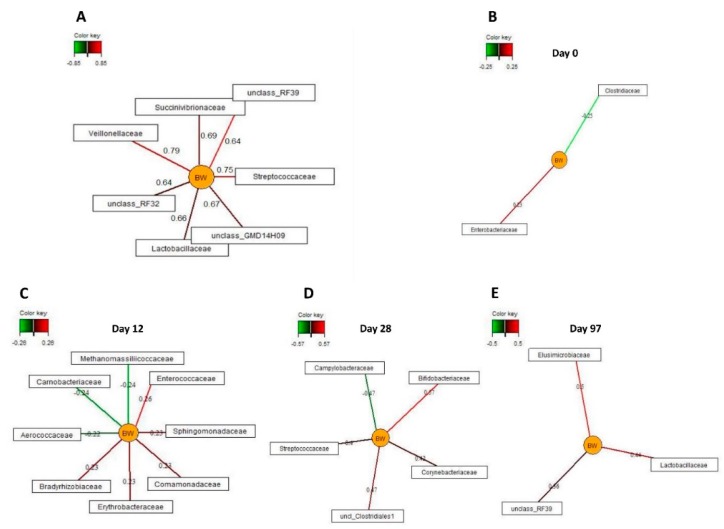
Figure 5.
Associations between the relative abundance of the most discriminative bacterial families (>0.05% of total reads) and body weight in female and male pigs receiving either the antibiotic (AB) or control treatment on day 0, 12, 28 and 97 of life. The associations were established separately using sparse partial least squares regression and relevance networking. The networks are displayed graphically as nodes (parameters) and edges (biological relationship between nodes). The edge color intensity indicates the level of the association: red = positive, and green = negative. Only the strongest pairwise associations were projected. (A) Relationships across all sampling time points (|r| > 0.6); (B) relationships on day 0 of life (|r| > 0.2); (C) relationships on day 12 of life (|r| > 0.2); (D) relationships on day 28 of life (|r| > 0.4); and (E) relationships on day 97 of life (r > 0.35).

