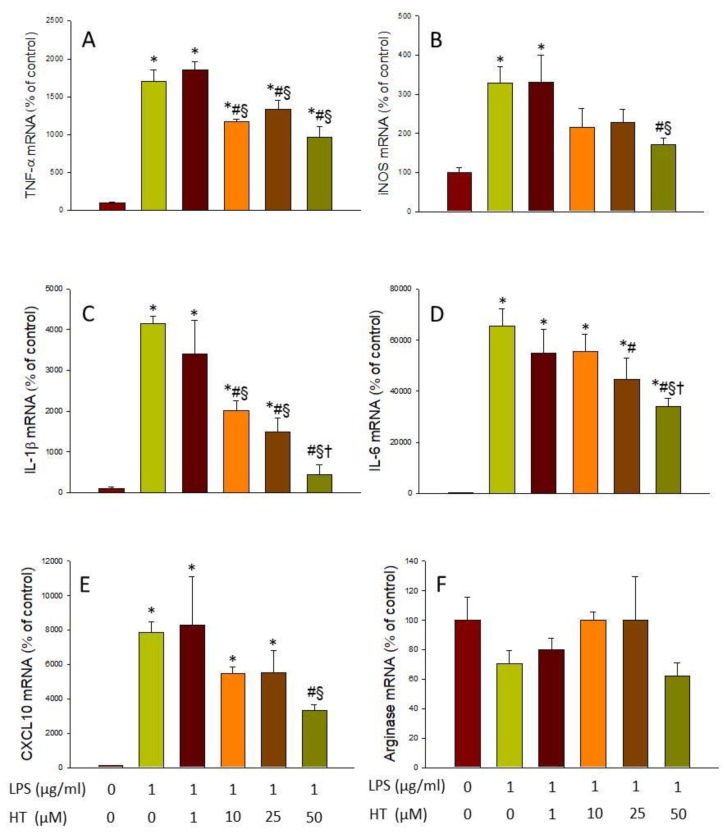
Figure 2.
Real-time RT-PCR. (A) tumor necrosis factor (TNF)-α gene expression; (B) inducible nitric oxide synthase (iNOS) gene expression; (C) interleukin (IL)-1β gene expression; (D) IL-6 gene expression; (E) CXCL10 gene expression; (F) Arginase gene expression, after the treatment with lipopolysaccharide (LPS) alone (1 mg/mL) or with HT (1, 10, 25, and 50 μM). Data are expressed as mean ± SEM (n = 3), normalized to β-actin, and expressed as percentage relative to the control group. Statistical significance (one-way analysis of variance (ANOVA) followed by the LSD post hoc test for multiple comparisons): * compared with the control group; # compared with the LPS group; § compared with the LPS + HT 1 μM group; † compared with the LPS + HT 10 μM group; p < 0.05.

