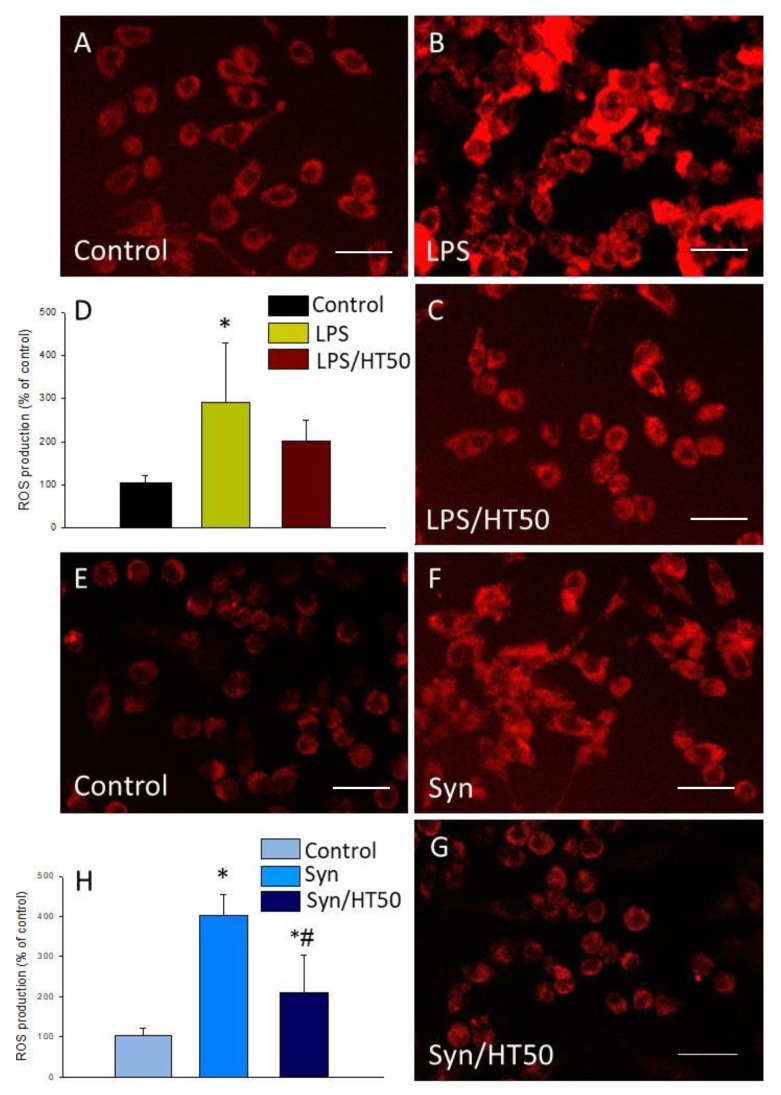
Figure 5.
Reactive oxygen species (ROS) production. ROS were measured 6 h after the different treatments assayed. (A) Control (BV2 cells); (B) LPS (1 mg/mL); (C) LPS (1 mg/mL) plus HT (50 μM). (D) Quantification of ROS production with LPS with or without HT. Results are mean ± SEM (n = 4), expressed as percentage of control. Scale bar, 50 µm. (E) Control (BV2 cells); (F) α-syn (5 μM); (G) α-syn (5 μM) plus HT (50 μM); (H) quantification of ROS production with α-syn, with or without HT. Results are mean ± SEM (n = 4). Results are expressed as percentage relative to the control group. Statistical significance (one-way ANOVA followed by the LSD post hoc test for multiple comparisons): * compared with the control group; # compared with the syn group; p < 0.05 (for LPS), p < 0.001 (for α-syn). Scale bar, 50 µm.

