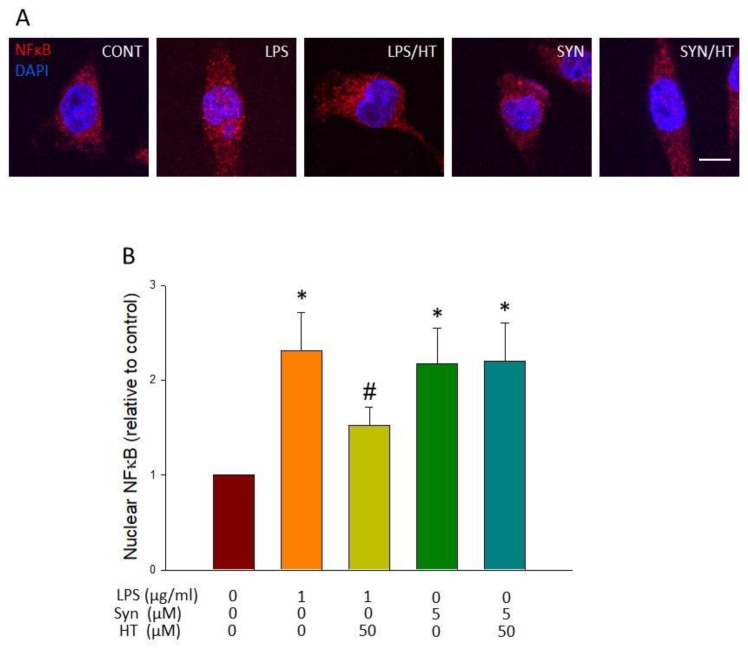
Figure 7.
Analysis of nuclear translocation of NF-κB p65. (A) Immunostaining of NF-κB p65 of control and treated cells showing its distribution in cytosolic and nuclear compartments. (B) Quantitative assessment of NF-κB p65 nuclear translocation is shown as fold change of nuclear staining in treated versus control cells (n = 4). Results are mean ± SEM, relative to control group. Statistical significance (one-way ANOVA followed by the LSD post hoc test for multiple comparisons): * compared with the control group; # compared with the LPS group; p < 0.05. Scale bar, 5 μm.

