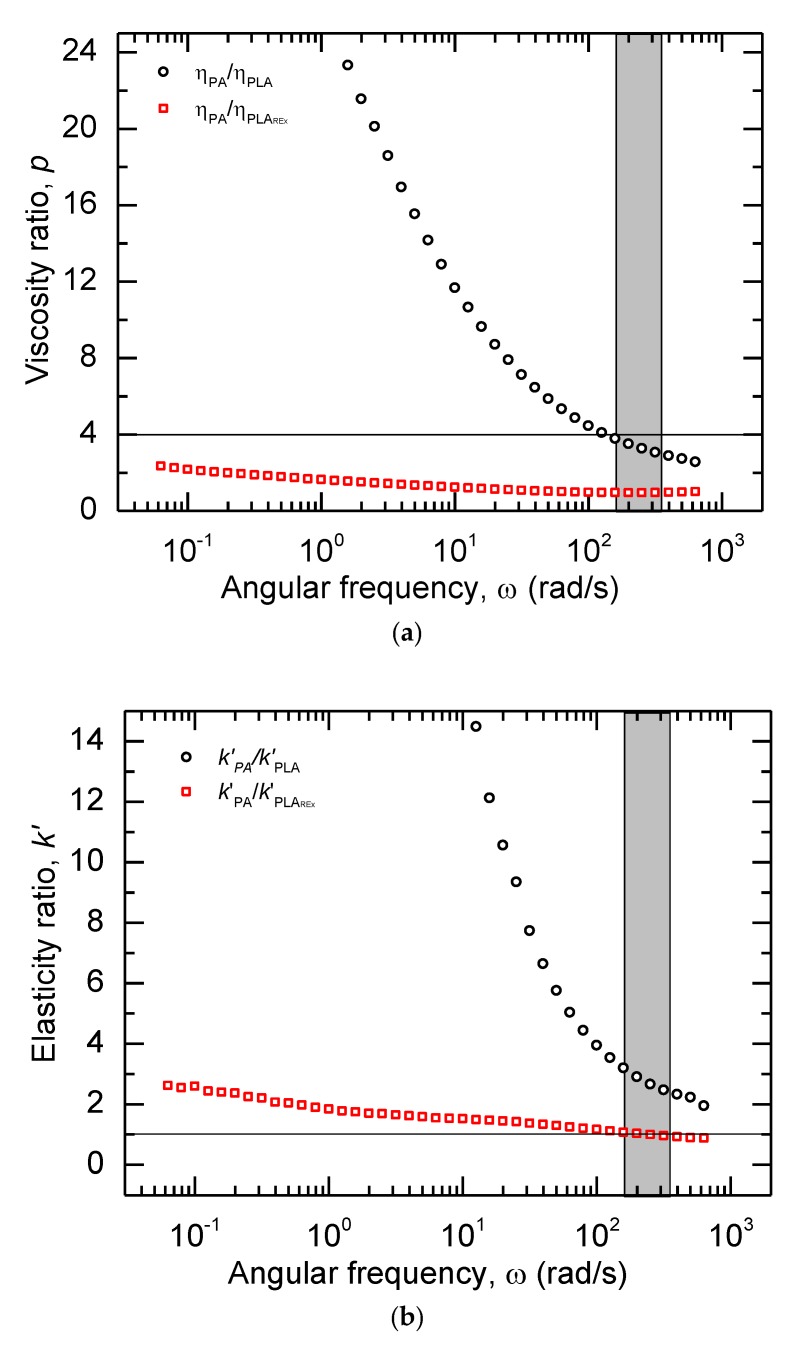
Figure 6.
Relative Rheological Parameters between the pristine polymers versus the angular frequency (ω) at 215 °C: (a) Viscosity Ratio (p); (b) elasticity ratio (k’). The shadowed region in gray represents the equivalent angular frequencies (ω) used in the extrusion process to prepare the bio-blends. The horizontal line marked in the graph represents the limit values of viscosity ratio (a) and elasticity ratio (b) to produce a fibrillated morphology.

