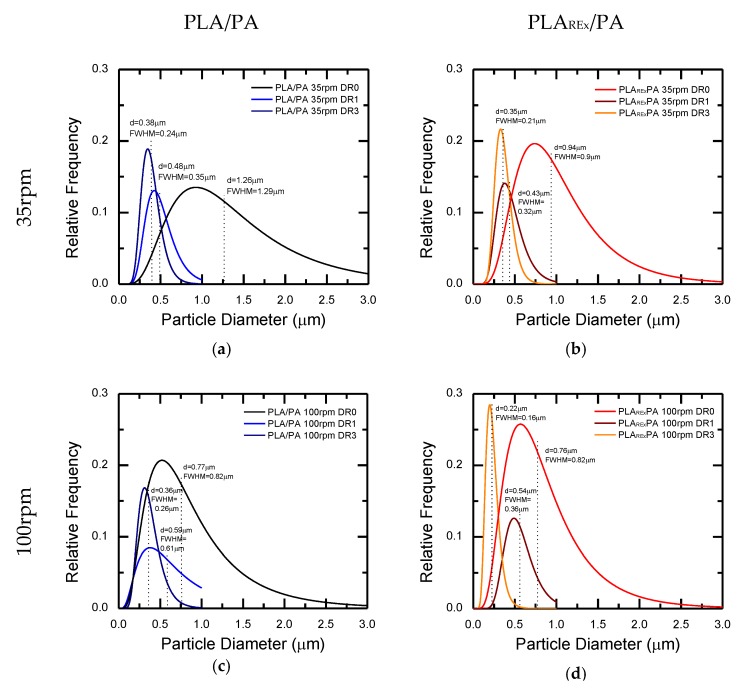
Figure 13.
Size distribution of the PA domains determined by image analysis from SEM micrographs in TD observation as function of the extrusion screw rotation speed (rpm) and draw ratios (DR) in the hot stretching stage. (a) and (b) PLA/PA and PLAREx/PA at 35rpm, respectively; (c) and (d) PLA/PA and PLAREx/PA at 100 rpm, respectively.

