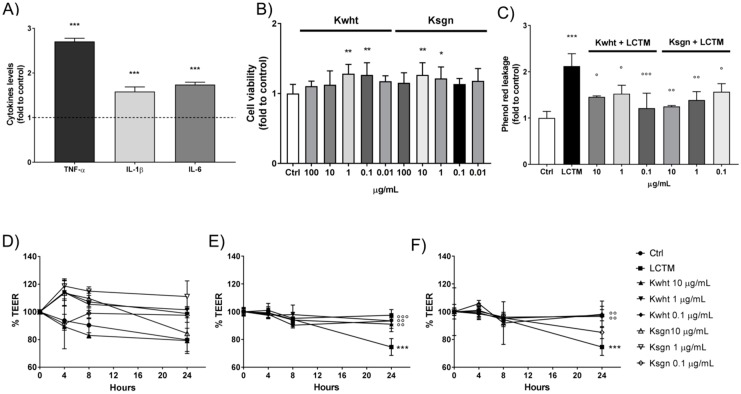
Figure 2.
Effects of KL5 and KL5E10 in the in vitro model of inflamed intestinal epithelium. (A) LPS-stimulated THP-1 cytokines release normalized to control (dashed line); (B) Caco-2 cell viability with different concentrations of the samples; (C) phenol red permeability assay; (D) effect of the samples on Caco-2 trans-epithelial electric resistance (TEER) in basal conditions; (E) effects of Kwht on Caco-2 TEER in inflammatory conditions; (F) effects of Ksgn on Caco-2 TEER in inflammatory conditions. * p < 0.05 vs. Ctrl; ** p < 0.01 vs. Ctrl; *** p < 0.001 vs. Ctrl; ° p < 0.05 vs. stimulus; °° p < 0.01 vs. stimulus; °°° p < 0.001 vs. stimulus.

