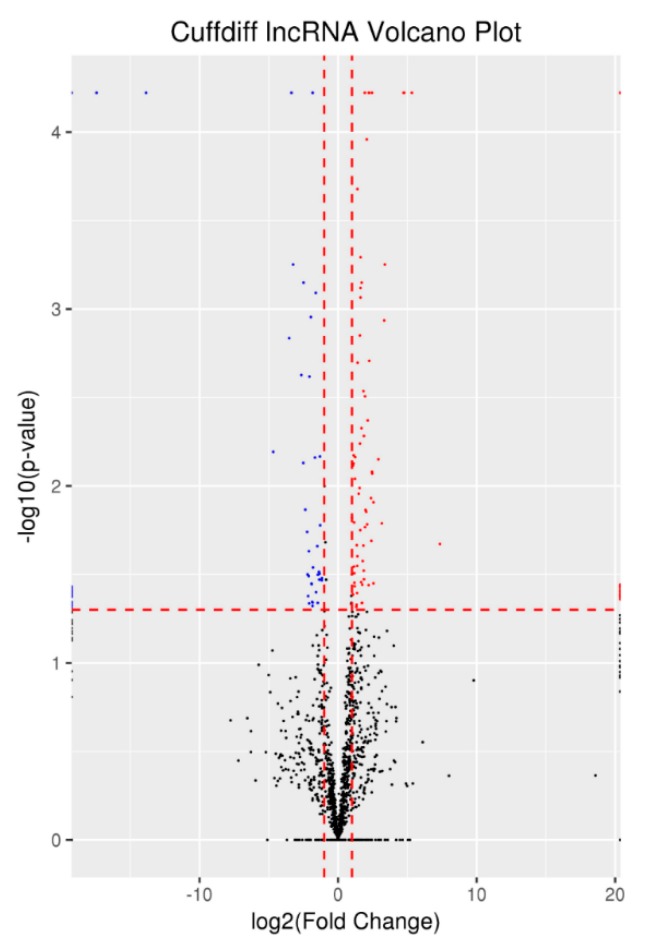
Figure 2.
Differentially expressed lncRNAs. Note: The horizonal dashed red line shows criteria of P values equal to 0.05 while vertical dashed lines show log2FC equal to -1 (left) and 1 (right). The points colored with red and blue show the genes if they are upregulated and downregulated, respectively. Black points mean genes does not meet the significant criteria.

