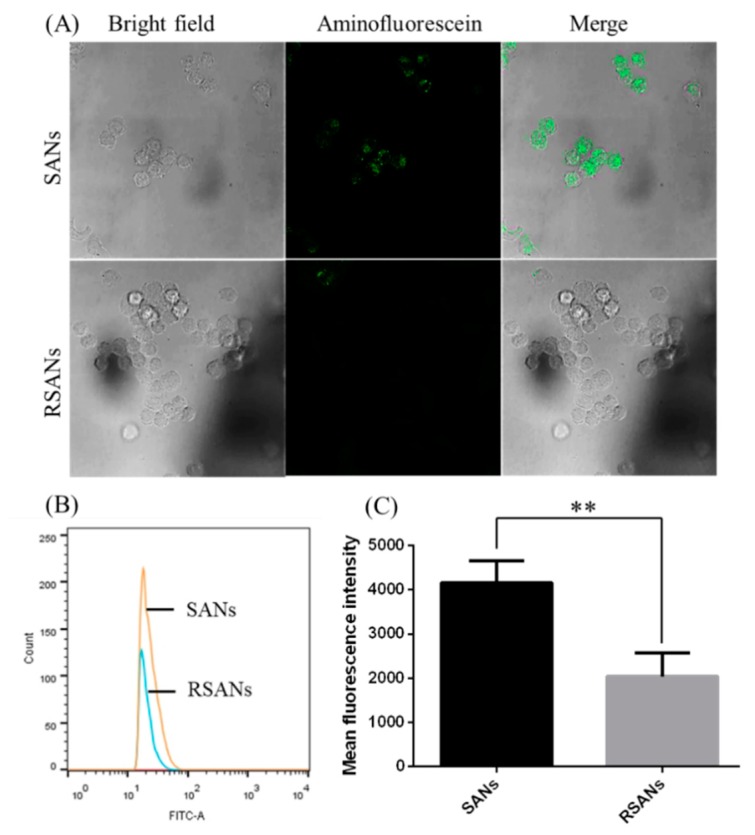
Figure 6.
Cellular uptake of SANs and RSANs on RAW 264.7 macrophages. (A) Confocal image 630×. The SANs were labeled with 5(6)-Aminofluorescein (green), (B) Fluorescence intensity detection by flow cytometry. (C) Quantitative analysis of the fluorescence intensity. Data are shown as ± SD of the mean (n = 3). ** correspond to p < 0.01.

