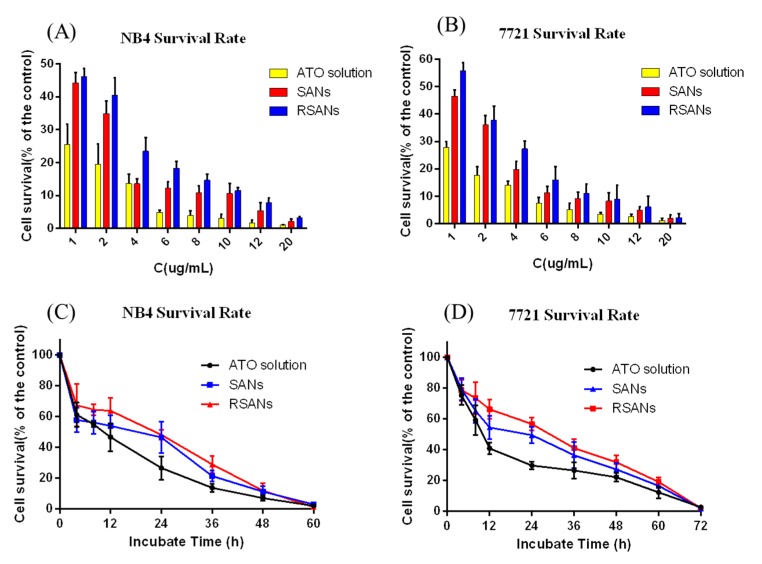
Figure 9.
The inhibition effects on NB4 and 7721 cells after administration with different formulations. Cell survival of NB4 (A) and 7721 (B) cells after administration with different concentrations of ATO, SANs and RSANs for 24 h. Cell survival of NB4 (C) and 7721 (D) cells after administration with multiple groups at the ATO concentration of 1 μg/mL for 72 h. Data are shown as ± SD of the mean (n = 3).

