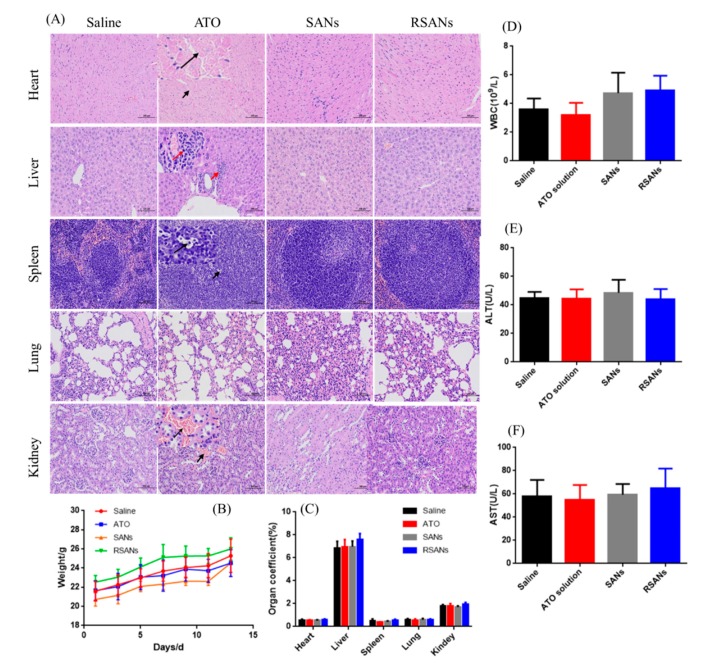
Figure 10.
In vivo toxicity and safety evaluation. (A) H & E staining of primary organs under 100 μm. (B) Weight changes of nude mice during the experiment. (C) Organ coefficients, (D) Number of white blood cells, (E) ALT, and (F) AST of each group at the end of the experiment. Data are shown as ± SD of the mean (n = 5).

