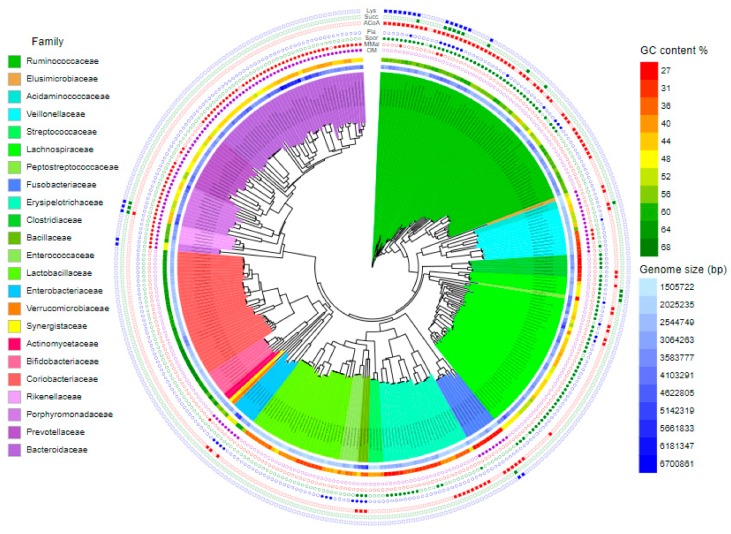
Figure 2.
Major bacterial species colonising the chicken caecum. Genomic GC content and genome sizes are shown using a colour gradient. Families are highlighted with background colors. Presence or absence of genes for outer membrane biosynthesis (OM), succinate-methylmaloneta-propinionate pathway (MMal), spore formation (Spor), flagellar (Fla) motility and butyrate production from acetyl-CoA (ACoA), lysine (Lys) or succinate (Succ) is shown by full symbols. See Supplementary Figure S1 to zoom in. Data in this figure originate from Medvecky et al. [30] complemented with recent laboratory results.

