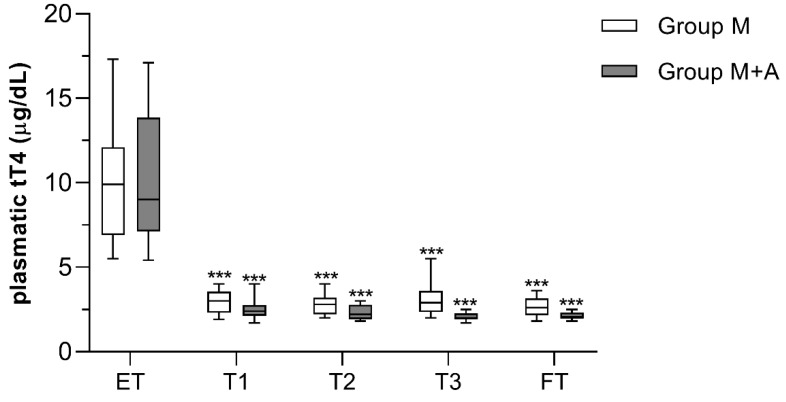
Figure 2.
Total plasma T4 (tT4) concentrations in hyperthyroid cats receiving methimazole and placebo (group M, n = 14), or methimazole and antioxidants (group M+A, n = 16). Asterisks indicate statistically significant differences compared to ET (*** p < 0.001). Statistical analysis was performed by two-way ANOVA for repeated measures followed by Sidak’s post-hoc test. ET = enrollment time; T1 = 15 days; T2 = 30 days; T3 = 90 days; FT = finish time (180 days).

