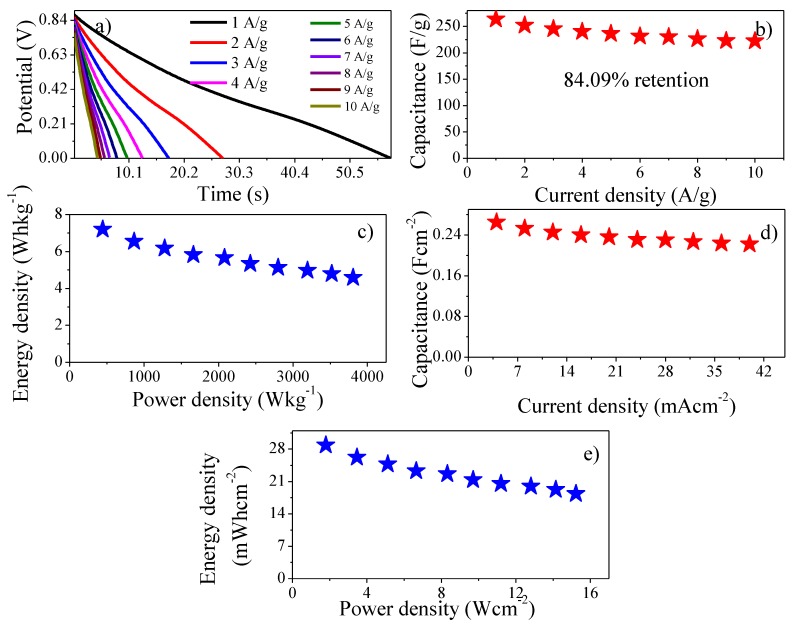
Figure 8.
(a) Discharge curve of the subject device at various current densities, (b) Specific capacitance vs. current densities plot, (c) The Ragone plot, (d) Dependence of the specific capacitance of the device on the volumetric current density (e) The Ragone plot based on the volumetric current density.

