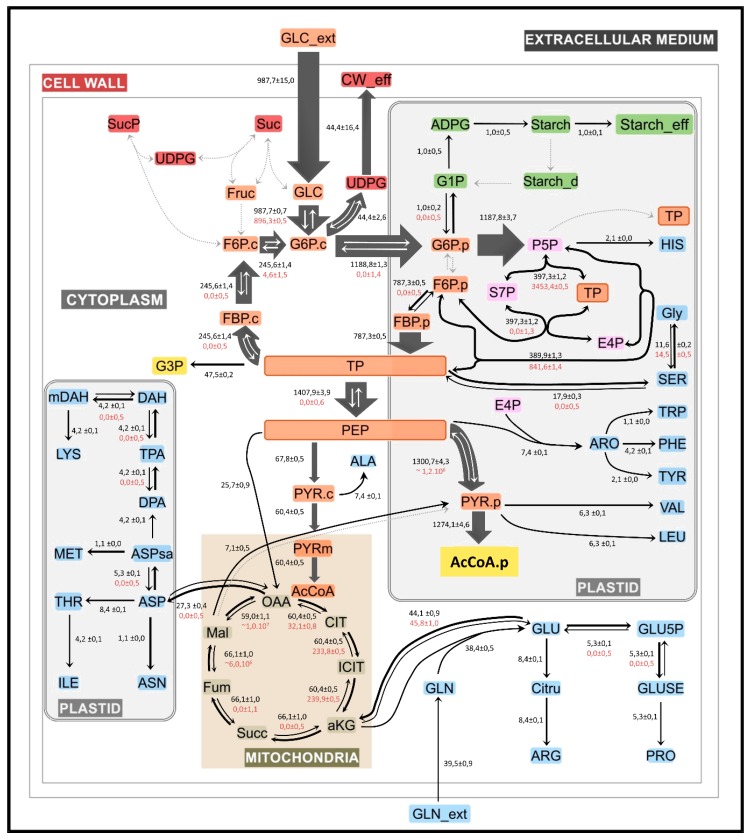
Figure 5.
Metabolic network and fluxes in flax embryos during maturation stage. The scheme presented is a simplified representation of the central carbon metabolism in flax embryos during fatty acid synthesis and TAG accumulation. Cytosolic and plastidial metabolites are specified by subscripts c and p, respectively, if the model distinguishes such subcellular species. All reactions, metabolites and abbreviations are available in Supplementary Tables S3 and S4. Values reported are the best fit obtained by INCA software using three parallel labeling experiments (53 metabolites and six extracellular fluxes). The average and standard deviation are calculated from four independent experiments. Fluxes are expressed in mmol/gDW/d ± confidence interval. The set of estimated flux values calculated by INCA software are presented in Supplementary Table S6. The metabolic map was drawn using the Omix software [41].

