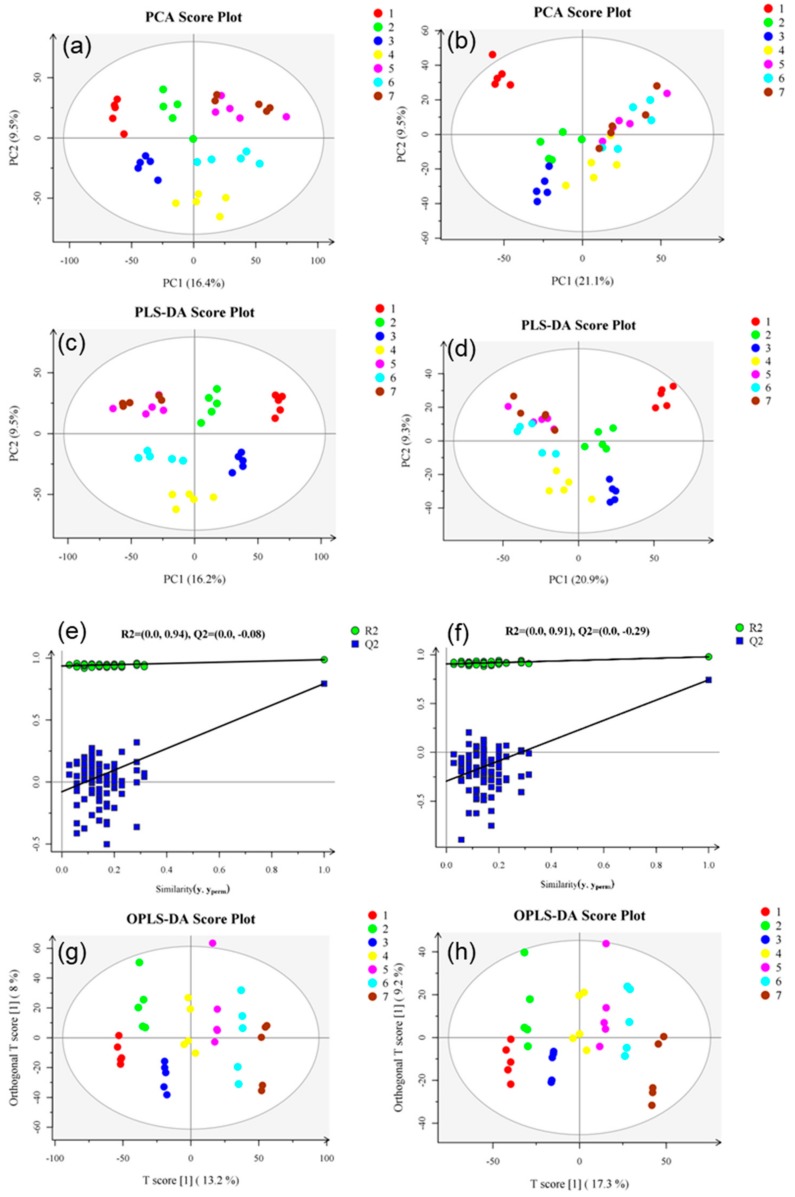
Figure 5.
PCA score charts based on NT-pos (a) and NT-neg (b), PLS-DA score charts based on NT-pos (c) and NT-neg (d), PLS-DA permutation plot based on NT-pos (e) and NT-neg (f), and OPLS-DA score charts based on NT-pos (g) and NT-neg (h). R2, the interpretability of the model; Q2, the predictability of the model. Samples from 7 different groups are represented by 7 different colors, and each group has 5 biological replicates.

