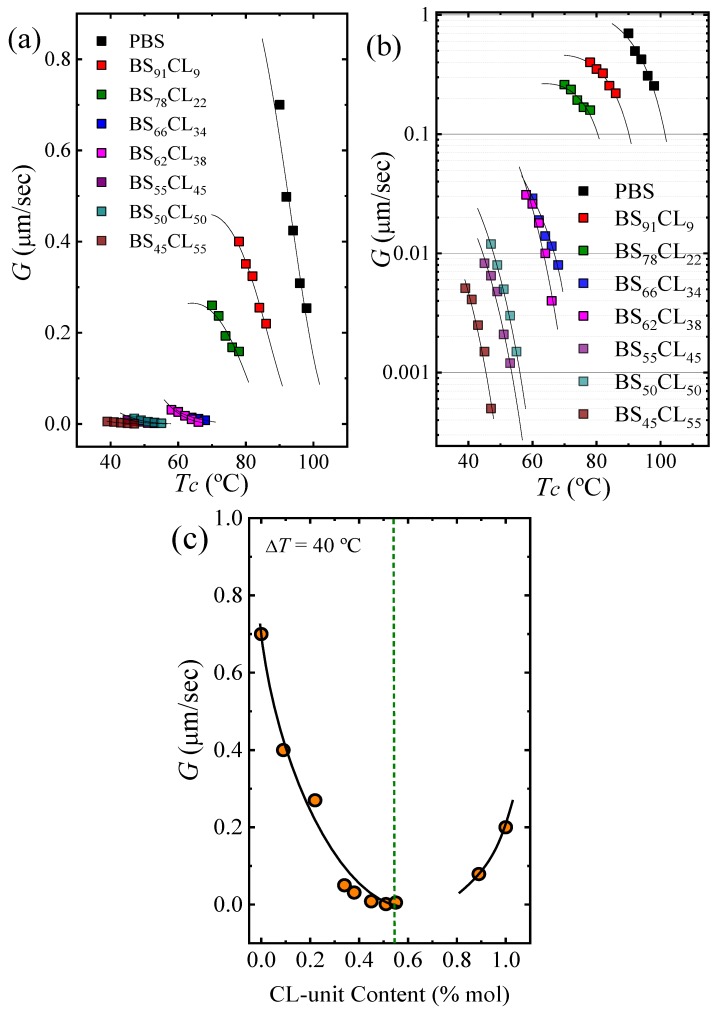
Figure 6.
Spherulitic growth rates determined by PLOM. (a) Growth rate, G, as a function of Tc. (b) Same data as in (a) but G is plotted on a logarithmic scale. The black solid lines are fits to the experimental data performed with the Lauritzen and Hoffman theory (L-H). (c) G versus CL-unit content at ΔT = 40 °C. The black line is an arbitrary polynomial fit drawn to guide the eye.

