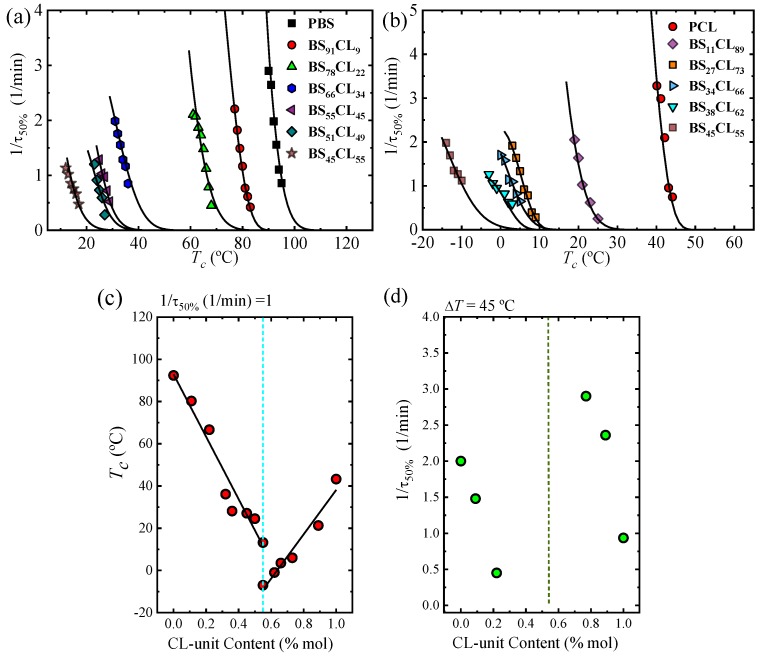
Figure 7.
Overall crystallization versus isothermal crystallization temperature for neat PBS and PBS-rich compositions (a) and for neat PCL and PCL-rich compositions (b) versus Tc. Continuous lines correspond to the fitting of the Lauritzen–Hoffman theory with the parameters in Table 3. Changes of Tc versus CL-unit content in a constant rate (1/τ50% = 1 min−1) (c). Changes of inverse of half-crystallization time, 1/τ50% versus CL-unit content in a constant supercooling degree, ΔT = 45 °C (d).

