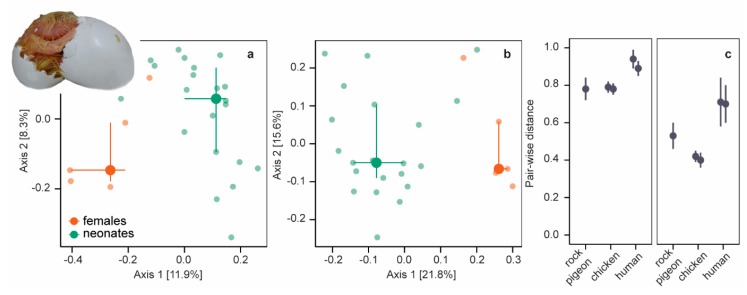
Figure 2.
Unweighted and weighted Unifrac distances. (a) PCoA plot of unweighted UniFrac distances of neonates (green symbols) and females (orange symbols). Large symbols present medians, the error bars the 25% and 75% quantiles. Transparent symbols present the underlying data. (b) PCoA plot of weighted UniFrac distances. (c) Mean pair-wise unweighted (left panel) and weighted UniFrac (right panel) distances (± SD) between embryos/neonates and females in five datasets: rock pigeon (n = 105 [this study]), chicken after incubation periods of 4 days (n = 324) and 19 days (n = 288) [20], and humans (n = 7488 [47] and n = 195 [48]).

