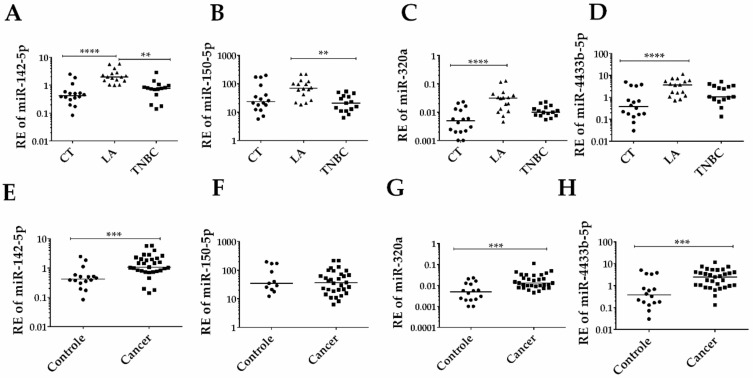
Figure 3.
Expression of the selected group of EV-miRNAs according to BC diagnosis and subtypes. (A) Significantly increased relative expression (RE) of miR-142-5p in Luminal A (LA) patients compared to Triple-negative (TNBC) patients (p < 0.0001), and control (CT) (p < 0.01). (B) miR-150-5p RE level is significantly higher in LA compared to TNBC patients (p < 0.01). (C) miR-320a and (D) miR-4433b-5p levels are higher in LA patients compared to CT (p < 0.0001 for both comparisons). (E) Significant overexpression of miR-142-5p in cancer (LA + TNBC) patients compared to CT (p < 0.001). (F) No difference in miR-150-5p level between cancer and control. (G) Significant overexpression of miR-320a and (H) miR-4433b-5p in cancer patients in comparison to controls (p < 0.001 for both). Cel-miR-39 was used as the exogenous control. BT-474 was used as a calibrator in all plates. The y-axis values are in log10, for a better presentation of the data. Analyses were calculated based on relative quantification (RQ) = 2−ΔΔCt values. ** p < 0.01; *** p < 0.001; **** p < 0.0001.

