Figure 5.
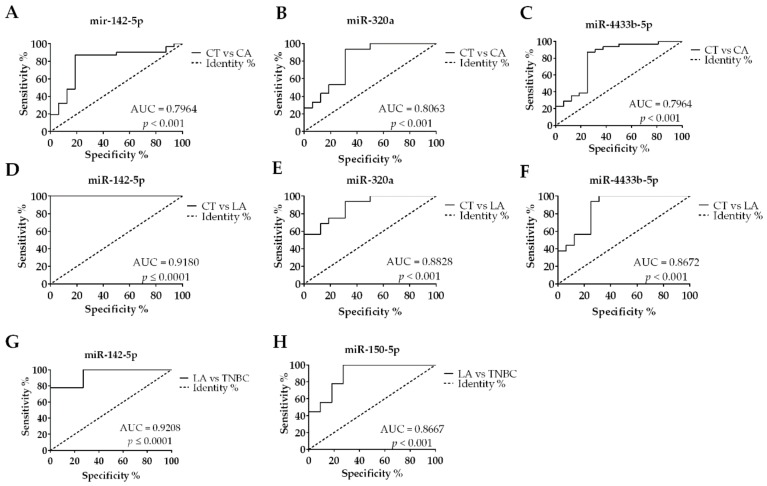
Individual receiver operating characteristic (ROC) curves from EV-miRNAs tested by RT-qPCR. (A) BC diagnosis accuracy calculated for miR-142-5p, (B) miR-320a, and (C) miR-4433b-5p. (D) Accuracy to diagnose Luminal A (LA) patients over Controls (CT) using miR-142-5p, (E) miR-320a, and (F) miR-4433b-5p. (G) Capacity to discriminate LA over Triple-negative (TNBC) patients using miR-142-5p and (H) miR-150-5p. ROC curves calculated based on relative quantification (RQ) values. Only area under the curve (AUC) > 0.79 are shown.

