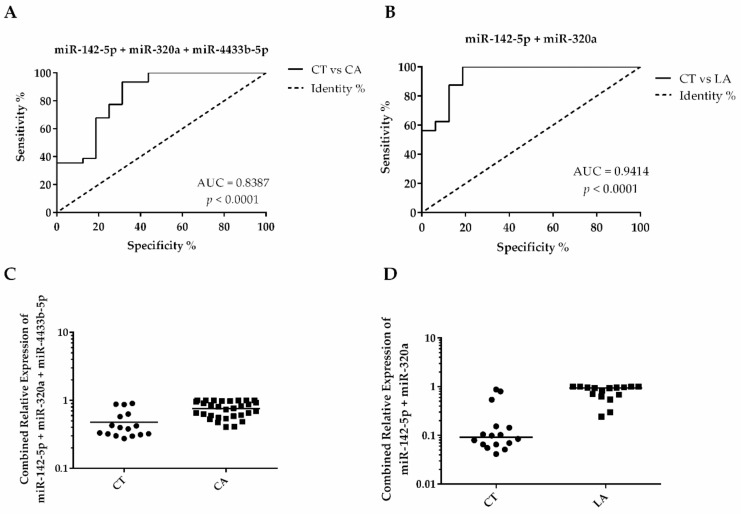
Figure 6.
Combined ROC curves and scatter plots indicating diagnosis potential of EV-miRNAs panels. (A) ROC curve calculated combining miR-142-5p, miR-320a, and miR-4433b-5p to diagnose BC. (B) Panel combining miR-142-5p and miR-320a showing excellent accuracy to diagnose LA patients. (C) Control (CT) and cancer (CA) distribution after binary logistic regression analysis combining relative quantification (RQ) values of miR-142-5p, miR-320a, and miR-4433b-5p. (D) CT and luminal A (LA) distribution after binary logistic regression combining RQ values of miR-142-5p and miR-320a.

