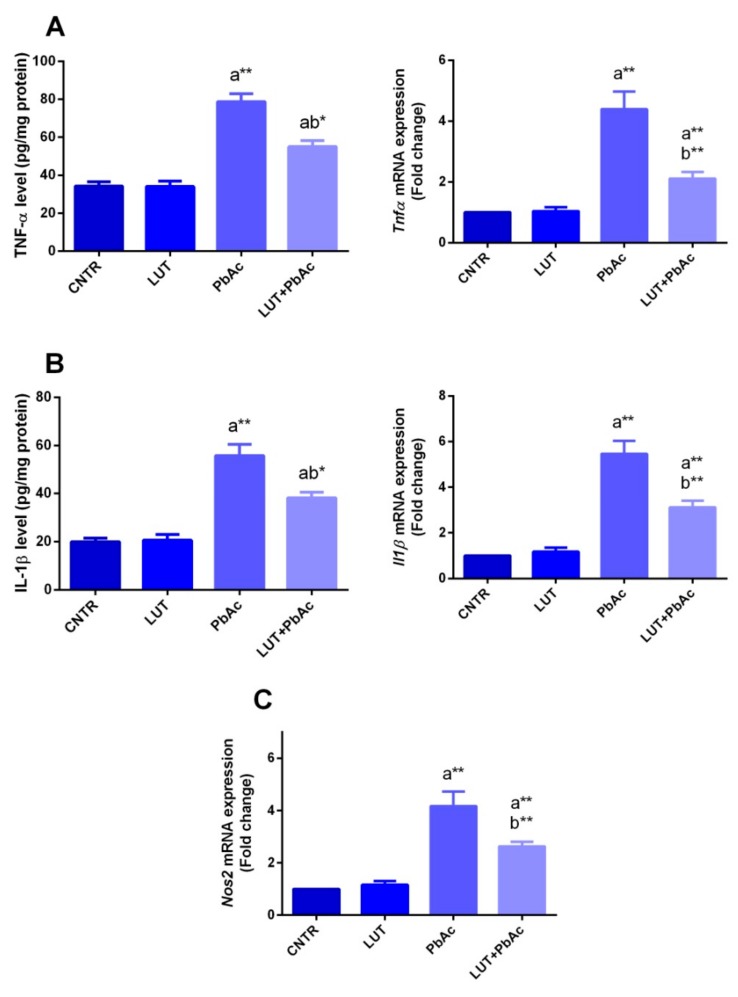
Figure 6.
Hepatic levels of TNF-α (A) and IL-1β (B) and Nos2 (C) mRNA expression following lead acetate (PbAc, 20 mg/kg, i.p.) and/or luteolin (LUT, 50 mg/kg, orally) exposure in male rats. The biochemical data are expressed as the mean ± SD (n = 7). mRNA expression results are recorded as the mean ± SD of five assays in duplicate referenced to Gapdh and represented as fold changes (log2 scale) as compared with the mRNA levels of the control group. a represents the statistical significance relative to that of the control group at p < 0.05. b represents the statistical significance relative to that of the PbAc-injected group at p < 0.05. * reflects the statistical significant differences between groups at p-values < 0.01. Moreover, ** reflects the statistical significant differences between groups at p-values < 0.001.

