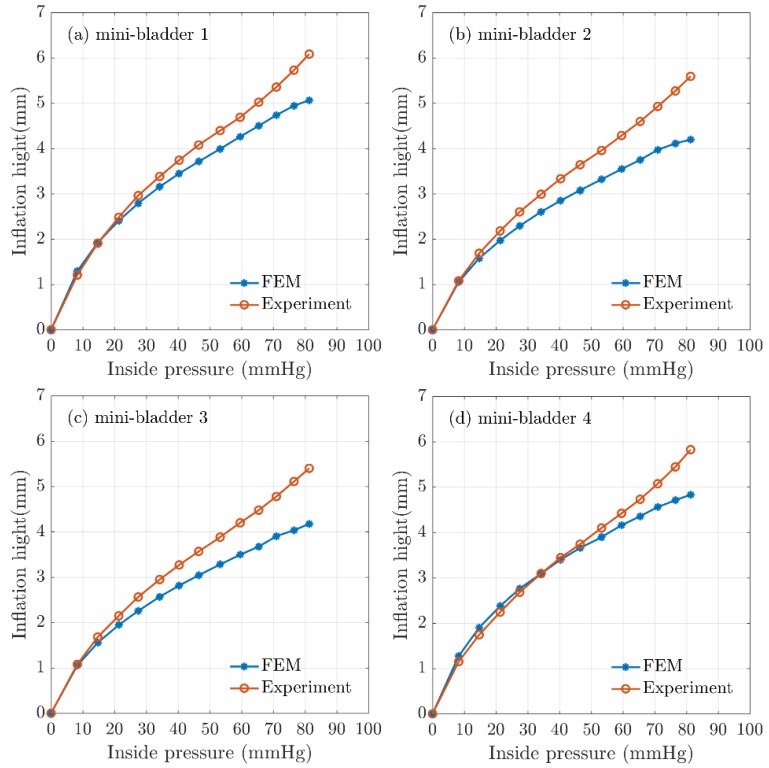
Figure 7.
Comparison of FEA results for inflation height and experimental mean height for hexagonal mini-bladder unit against the pressure between 0mmHg and 85 mmHg. Experimental data are shown in orange (mean height values) and the model values shown in blue for (a) mini-bladder 1, (b) mini-bladder 2, (c) mini-bladder 3, and (d) mini-bladder 4.

