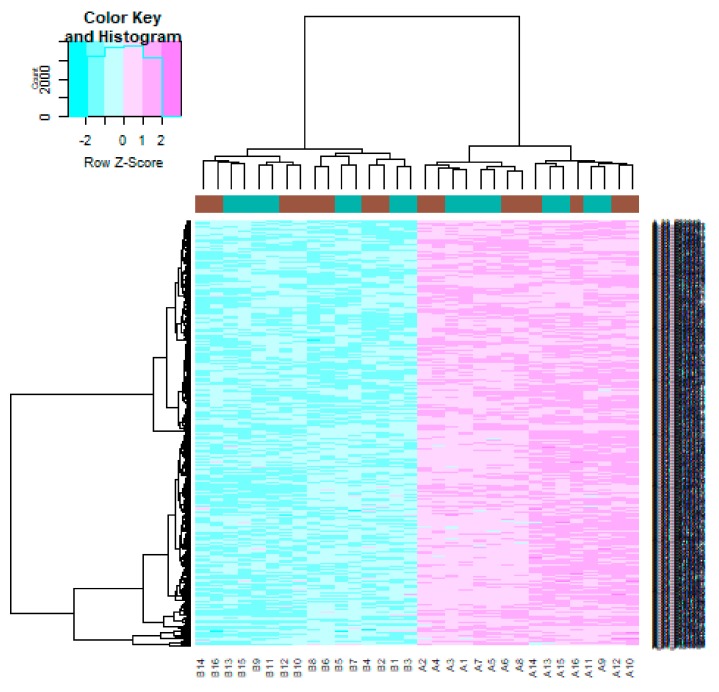
Figure 5.
Heat map of down regulated differentially expressed genes. Legend on the top left indicate log fold change of genes. (A1, A2, A3, A4, A5, A6, A7, A8, A9, A10, A11, A12, A13, A14, A15, A16 = male human CAD samples; B1, B2, B3, B4, B5, B6, B7, B8, B9, B10, B11, B12, B13, B14, B15, B16 = female human CAD samples).

