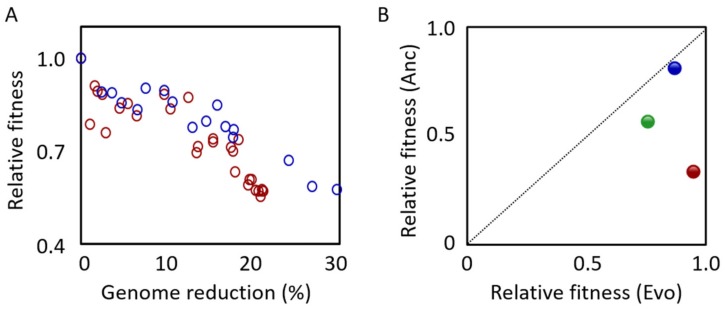
Figure 2.
Growth decline and growth recovery of reduced genomes. (A). Correlation between the growth rate and genome reduction. The ratio (%) of the reduced fragment relative to the wild-type genome is indicated. Relative fitness indicates the ratio of the growth rate of the cells with reduced genomes relative to that of the parent strain cells (wild-type genome). The red and blue circles represent the reduced genomes of the MGF-01 and Δ16 derivatives, respectively. The plot was made using the data sets of the previous reports [7,8]. (B). Increased growth fitness attributed to experimental evolution. The relative fitness before (Anc) and after (Evo) experimental evolution are shown. Blue, green and red stand for the genome-reduced strains of MDS42, MGF-01 and MS56, respectively. The growth data was cited from previous studies [55,56,57].

