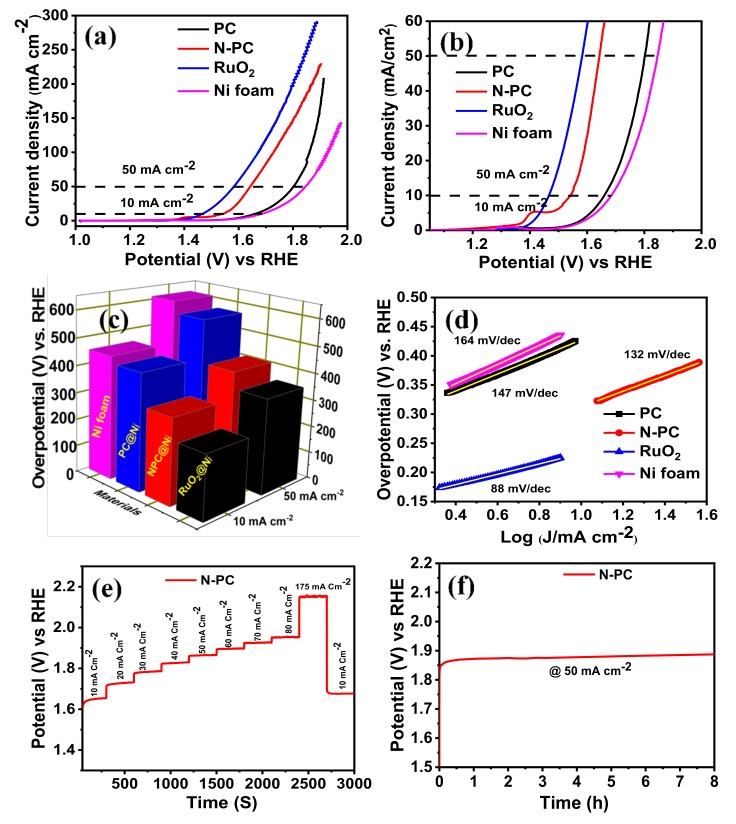
Figure 8.
(a,b) Oxygen evolution reaction (OER)-LSV curves of PC@Ni, N-PC@Ni, RuO2@Ni and Ni foam in 1 M KOH at a scan rate 1 mV s−1 [with iR-correction]; (c) bar of prepared catalyst vs overpotential at 10 and 50 mA cm−2; (d) Tafel slopes of PC@Ni, N-PC@Ni, RuO2@Ni and Ni foam; (e) multiple-step chronopotentiometric of N-PC@Ni; (f) chronopotentiometric curve of N-PC@Ni at a constant of 50 mA cm−2.

