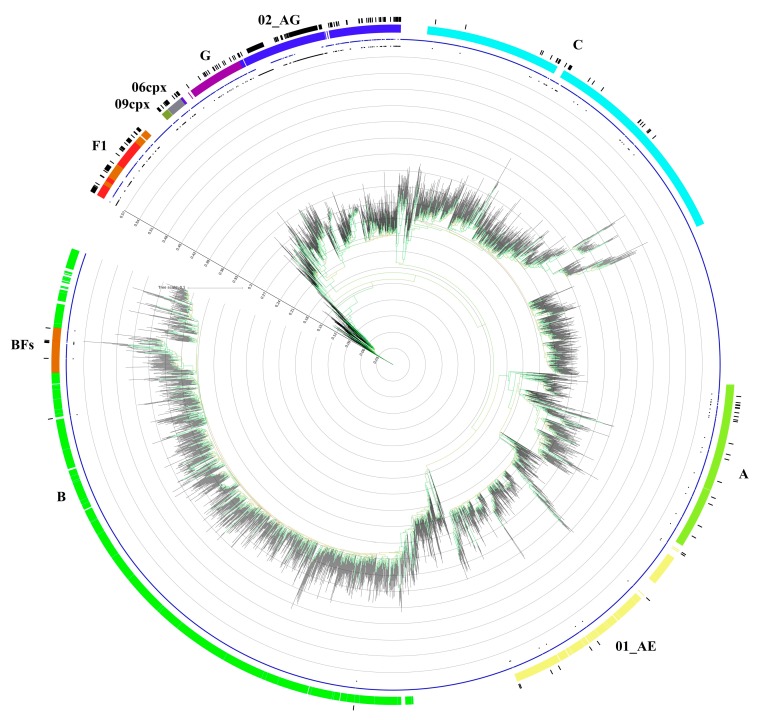
Figure 1.
Phylogenetic tree generated by using the GTR + G + I subsidence model and 1000 replicated bootstrap analysis with the IQ-Tree software. The dataset (which includes 293 sequences originating from antiretroviral therapy-naive patients) is compared to a custom sequence database composed of all the reference sequences present in the LosAlamos database (3497 total aligned sequences from reference sequences and filtered web alignments). The colored ring represents only the subtypes found in the study population, and the black ring represents the samples taken into consideration. The blue star symbols represent the reference sequences, and the black circle symbols represent the analyzed samples. The bootstrap value is represented by the color of the branches; the minimum value is 60, and it is represented in red by scaling the gradient up to 100, which is colored green.

