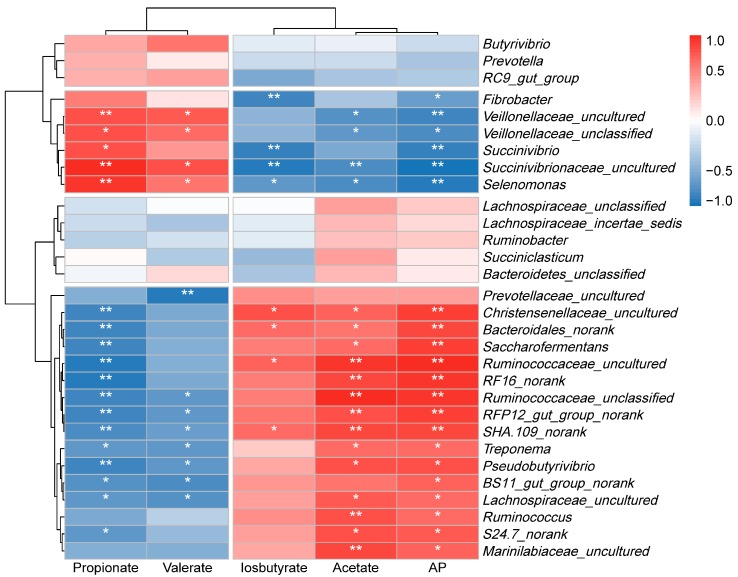
Figure 3.
Relationships between bacterial communities and fermentation parameters in the rumen of lambs fed different protein and energy level diets. Strong correlations are indicated by red and blue colors with 1 indicating a perfect positive correlation (dark red) and −1 indicating a negative correlation (dark blue), whereas weak correlations are indicated by white colors. Spearman test, * p < 0.05, ** p < 0.01.

